
Every State's COVID Numbers in Context, February 2021

This is the last monthly COVID report that I’m doing with the COVID Tracking Project data, as they will be suspending their project in another 2 weeks. This causes me no small amount of panic, but I’ll find a good data by the time March comes around.
The summary for this month is that the winter surge is pretty much over. Cases are falling, deaths are falling, vaccines are rising. This is all good news.
If you really need some bad news, be aware that there are some concerning data points out there. This continues to be a race of getting more vaccines produced and into arms as quickly as possible.
If case you want to compare this issue with the previous months:
Here is what is going on with COVID this month:
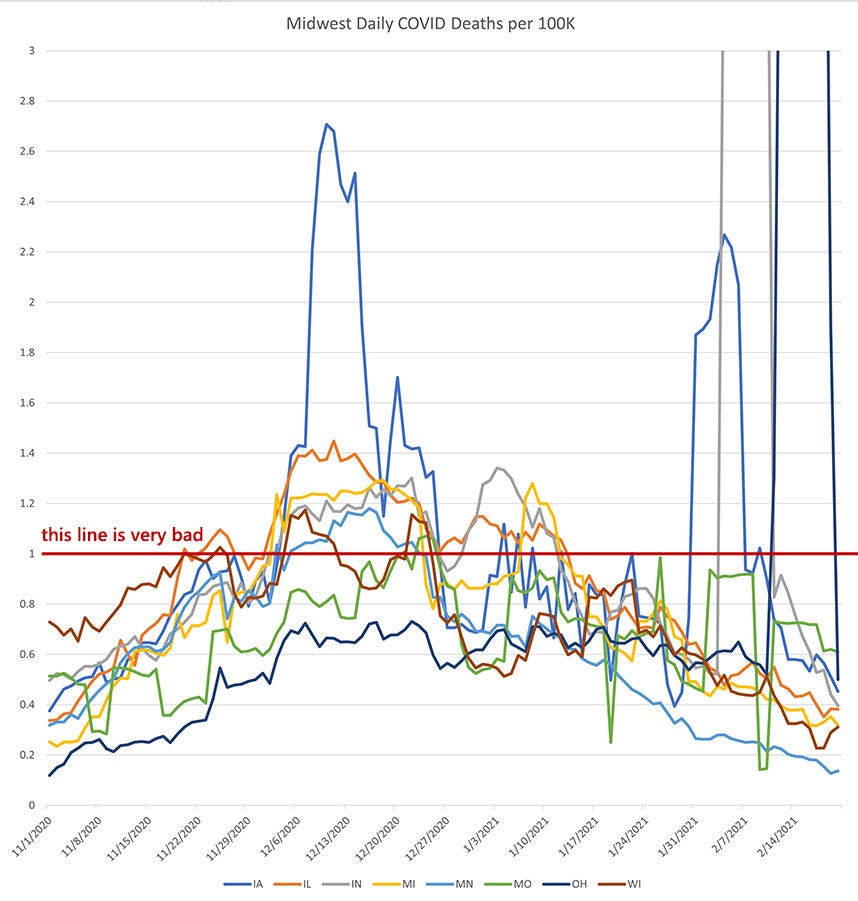
Midwest (Iowa, Illinois, Indiana, Michigan, Minnesota, Missouri, Ohio, Wisconsin)
Mountain States (Colorado, Idaho, Nevada, Utah, Wyoming)
Northeast States (Connecticut, DC, Delaware, Massachusetts, Maryland, New Jersey, New York, Rhode Island, Pennsylvania)
Southern Border (Alabama, Arizona, California, Florida, Louisiana, Mississippi, New Mexico, Texas)
Mid-South (Arkansas, Georgia, Kentucky, North Carolina, South Carolina, Tennessee, Virginia, West Virginia)
Plain States (Kansas, Montana, North Dakota, Nebraska, Oklahoma, South Dakota)
West Coast (Washington, Oregon, California)
Upper Northeast + Alaska & Hawaii (Vermont, New Hampshire, Maine, Alaska, Hawaii)
Summary
Midwest
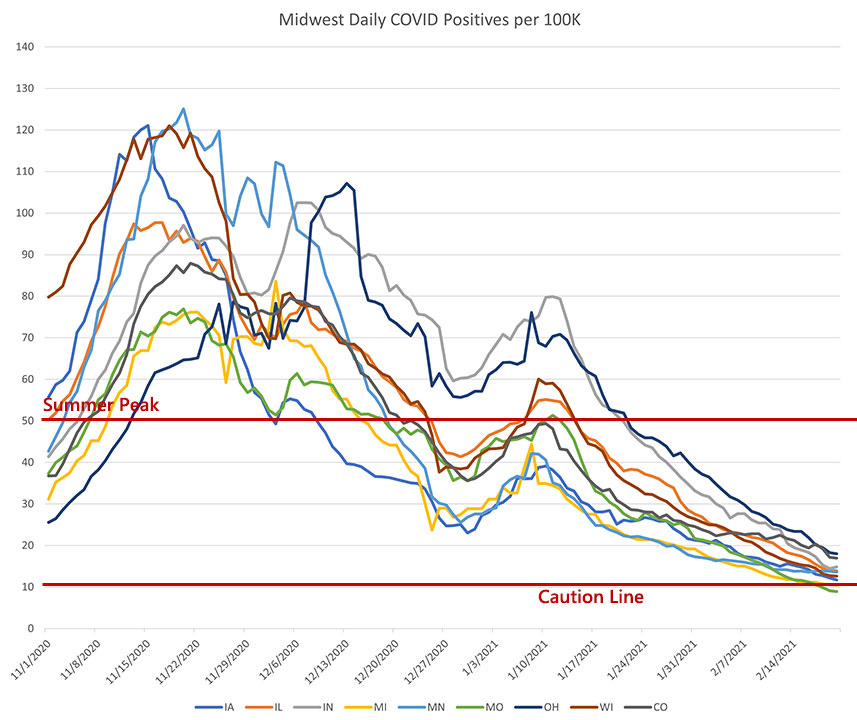
When I started doing these monthly reports, I put the Midwest at the top because they were a good region to start with. They had gotten hit hard by the initial wave, but not super hard. It was an way to sort of ease into the data conversation.
So of course time makes fools of us all and now the Midwest death chart is an exhausting pile of insanity. Let me tackle that first. I don’t know the details of each state, but it seems that Indiana, Iowa, Ohio, and Missouri all did some kind of end-of-year audit and collectively found thousands of previously unreported COVID deaths. I declined to stretch the chart up high enough to shot the peak b/c the peak isn’t telling us anything about the COVID situation in real time, it’s just telling us that there was an audit.
In a perfect world, those numbers would be added retroactively to the chart and I suspect that the CDC will do this in future data releases. Assume that these states’ lines (especially Ohio) should be a few ticks higher through most of the winter wave.
As for what is happening now, all states continue to slide down in both cases and deaths. I expect this to plateau at a certain low point within a few weeks.

The Midwest is moving forward nicely on vaccine distribution and administration. They are out-striping the 100 million dose target, which is good. Between dropping cases and rising vaccines, there is good reason to be optimistic.
Mountain States

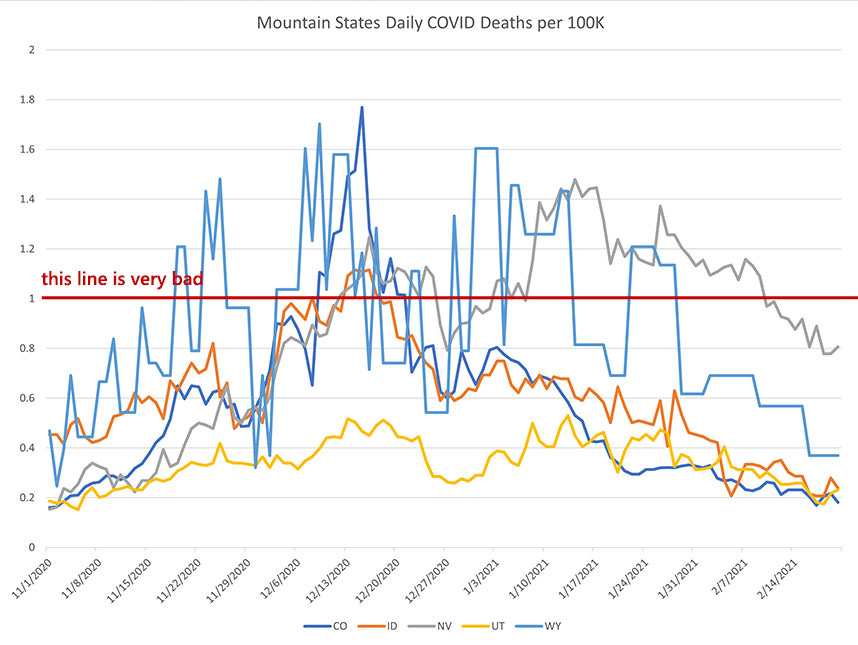
The toughest point in the mountain state is watching Nevada struggle to pull it’s death rate down. Every other point is looking good. Cases are dropping, the surge in deaths is largely over.
Across the board, I expect a plateau or maybe a slow slope downward as vaccines start depressing cases.

There’s a little more spread in vaccine administration in the mountain states than in the Midwest, but every state is well above the 100 million doses target, which is encouraging. Sure, Idaho and Nevada are lagging behind the other states, but they are moving forward & are hitting the target.
Northeast States
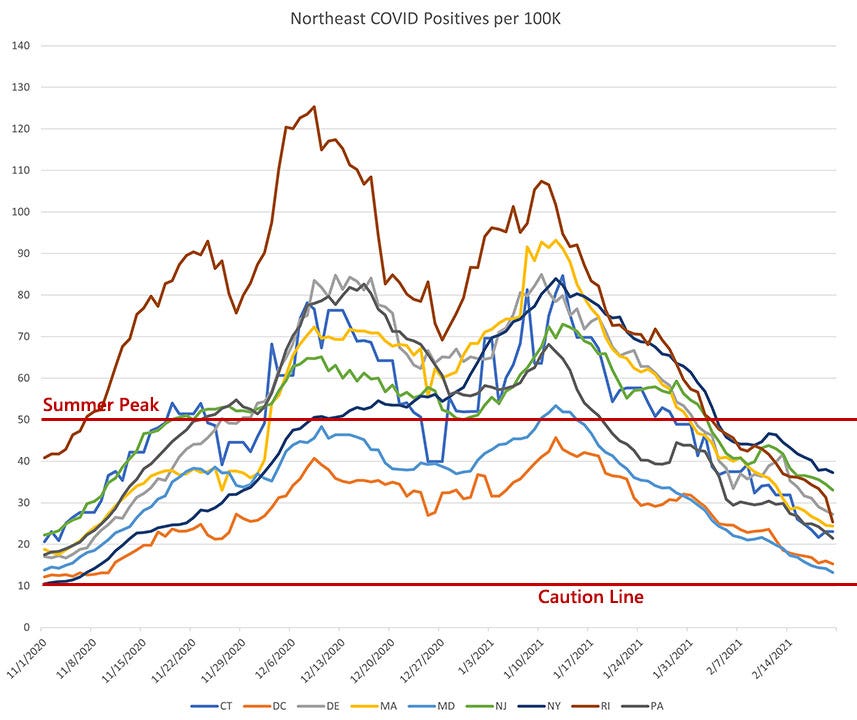
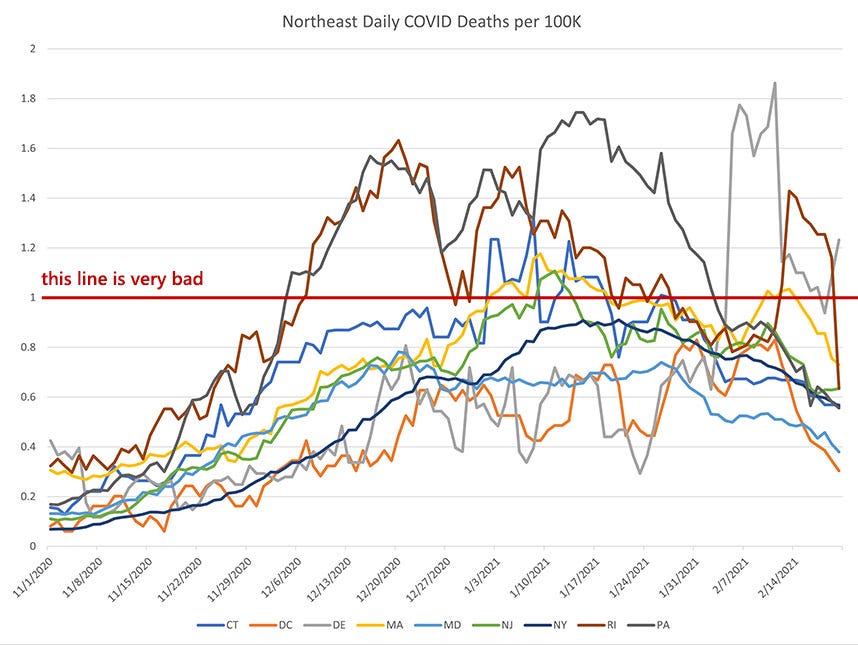
Comparing the northeast to the mountain states is a near-perfect microcosm of why I tend to think that this pandemic is largely running out on its own schedule with interventions making only a limited impact. We can see the northeast surging shortly after the mountain states and we can see that they are trailing behind on the case reductions.
Even so, we see the same pattern. Cases and deaths are past their peak and are sliding downward. Out hope is that cases can dip below the caution line within the next month or so (though I’m far past making any predictions on this).
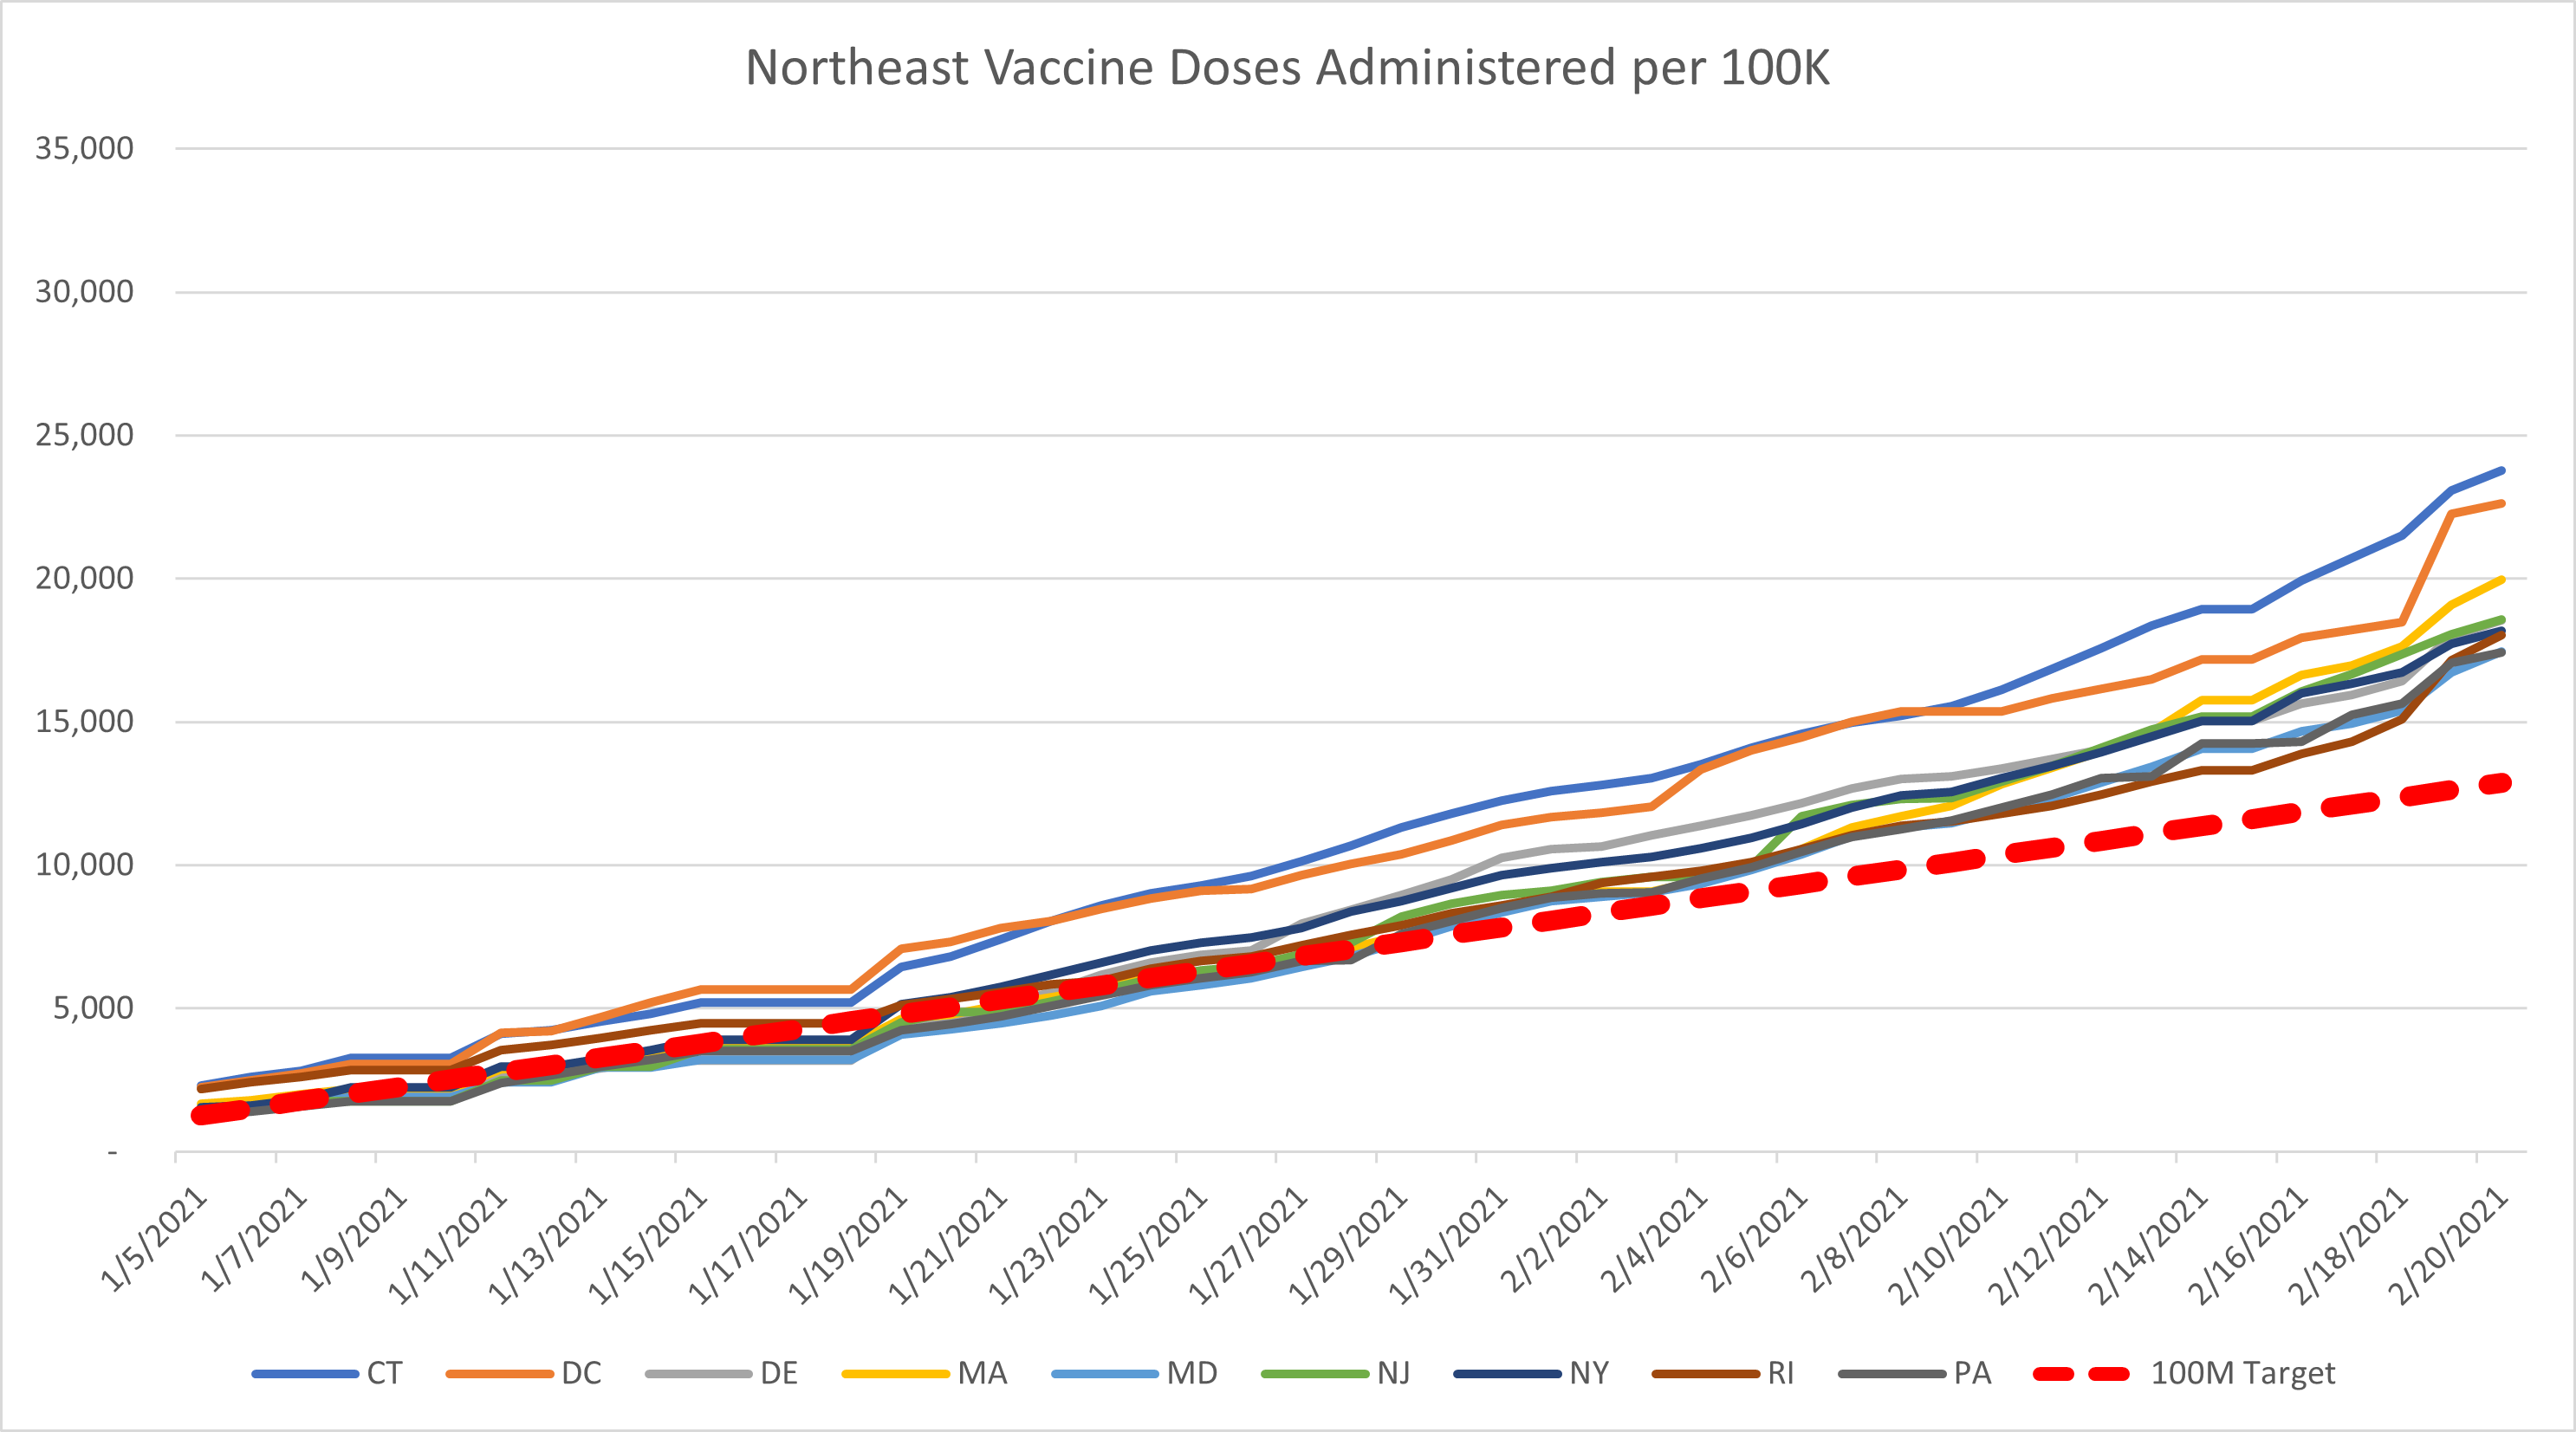
I almost wish vaccine administration was more interesting to look at except that I don’t really want that. I’m content with watching the line steadily and consistently outpacing the targets we need to hit. Bravo to Connecticut and DC for well, but every state seems to be running well.
Southern Border
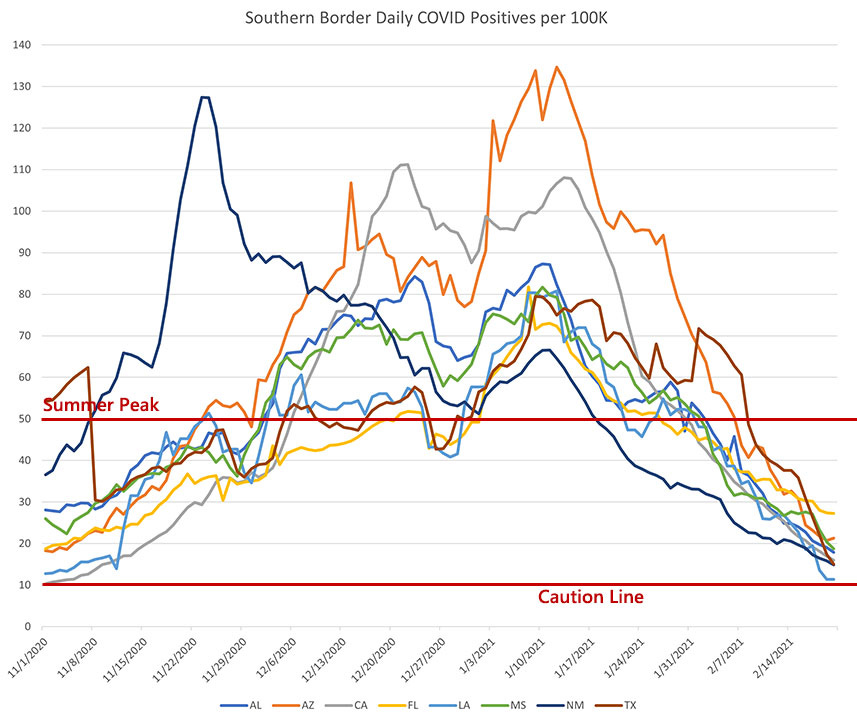
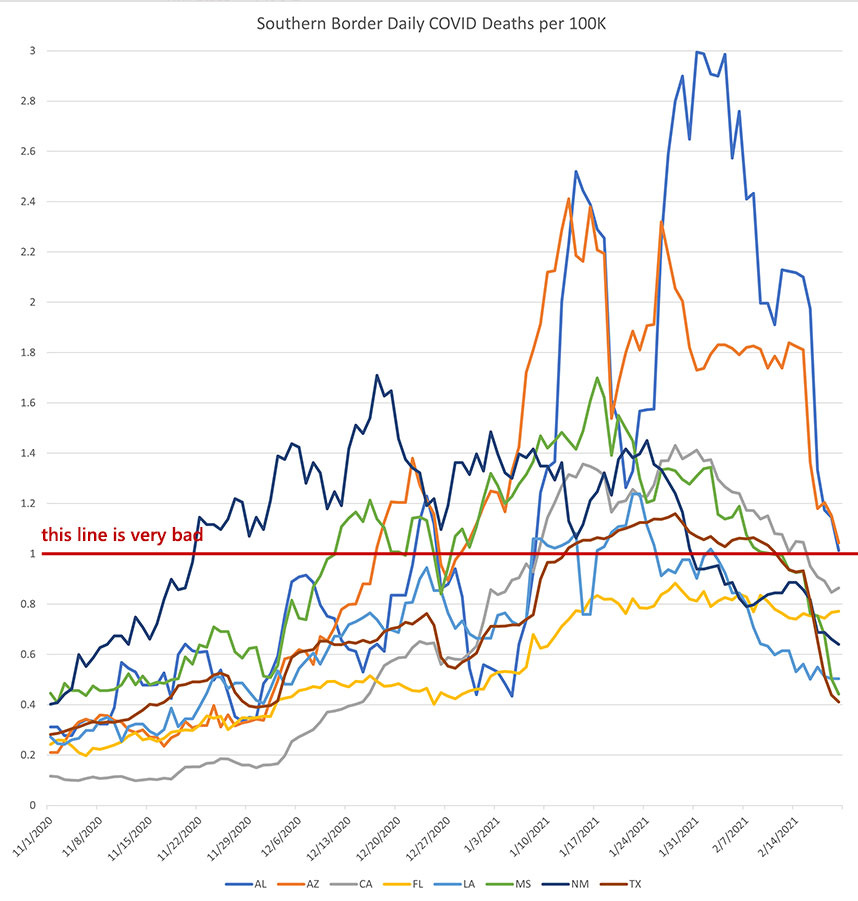
Man, Alabama and Arizona have just gotten hit hard with every wave that hits. The southern border states are in a similar surge calendar as the northeast. There is still plenty of space to see reductions in deaths and cases, but all the states are down under 30 cases per 100K. With this downward trajectory and vaccine uptake, I hope we can settle into a low plateau fairly soon.

I have to say, I expected vaccine distribution to slow down more than it has in Texas due to the power outages and cold crisis of the last few weeks. Yes, they’re on the low side of the region (and that is a big deal because they have so many people) but I really did expect them to fall below the target for 100 million vaccines. That they have not is incredibly encouraging. I hope as it warms up that we see a substantial surge in vaccine administration in the region.
Mid-South
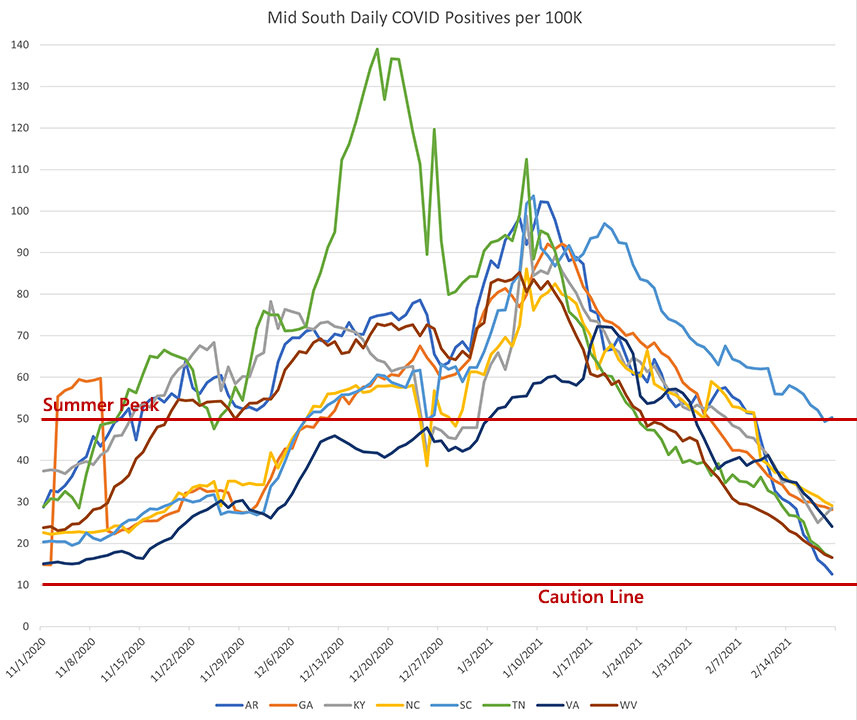
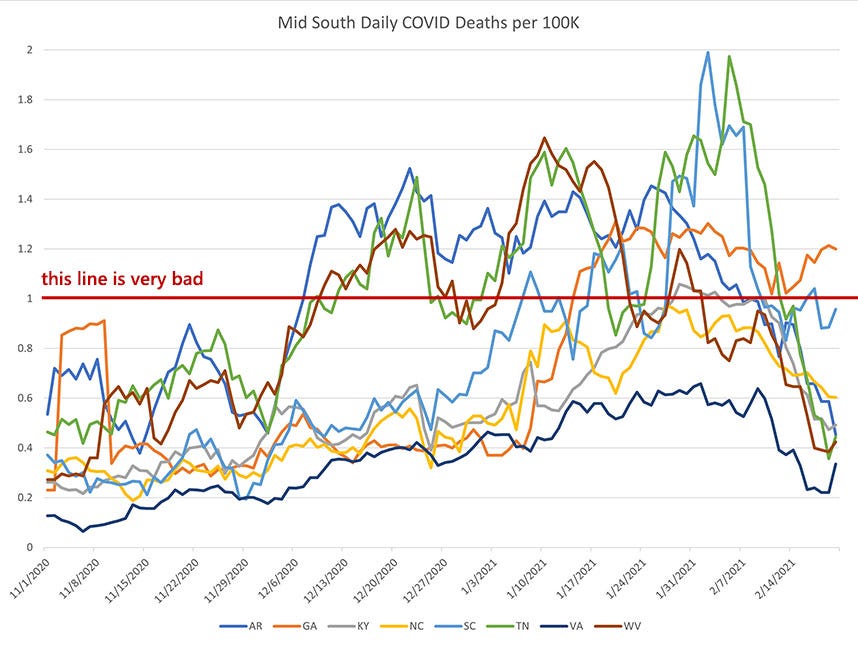
Tennessee had a particularly rough winter and I’m glad to see their cases and deaths are finally dipping back down. South Carolina is similar to Arizona, Louisiana, and Alabama inasmuch as they just keep getting hit harder than the surrounding states with every surge.
It is particularly odd to see almost every state in this region follow a near-exact pattern of case reduction in January-February. We would certainly like to see the death rate drop a little sooner and faster in Georgia and South Carolina, but I suspect that is in their near future, as they saw their case surges trailing the AR-TN-KY-WV surge by a few weeks.

Once again, bravo to West Virginia for their absolutely stunning vaccine success. They will almost certainly reach the milestone of having one third of their adult population vaccinated in March and we should start seeing those effects play out fairly clearly in the data at that point.
Plain States

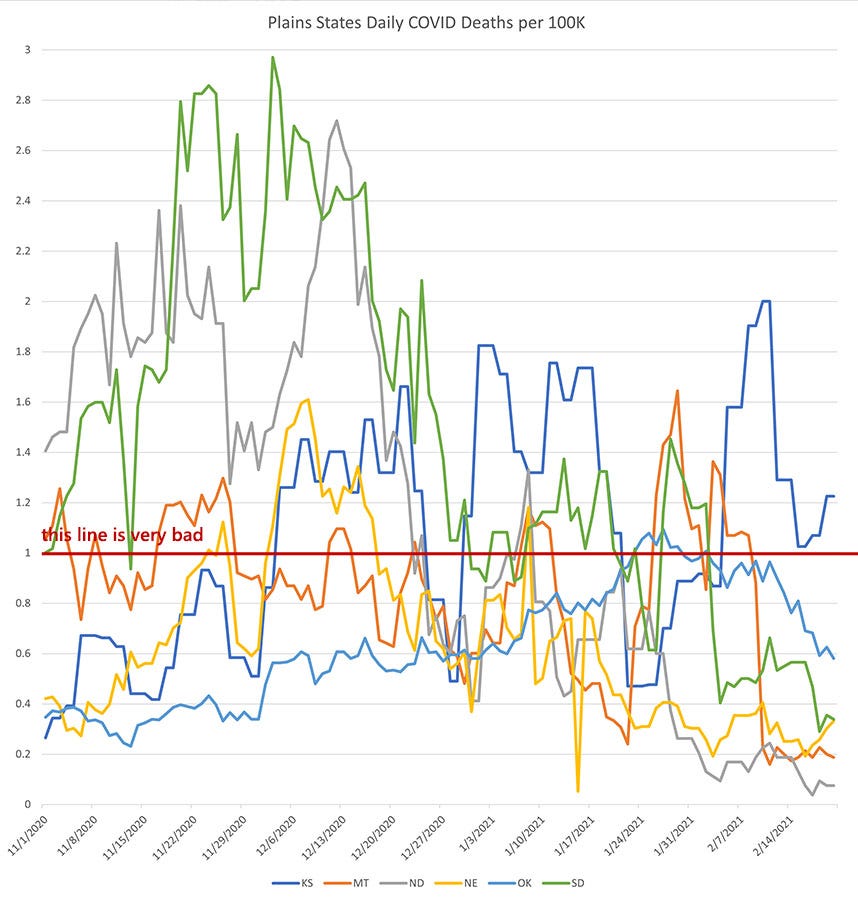
It is pretty amazing to see the plains states case numbers take that nose dive down from over 100 cases per 100K population down to the 10-20 range. The death data is a lot more ragged, but that is partly because of the sparse population of the states. Even a few more deaths on a week-by-week basis can cause the graph to jitter like an earthquake.
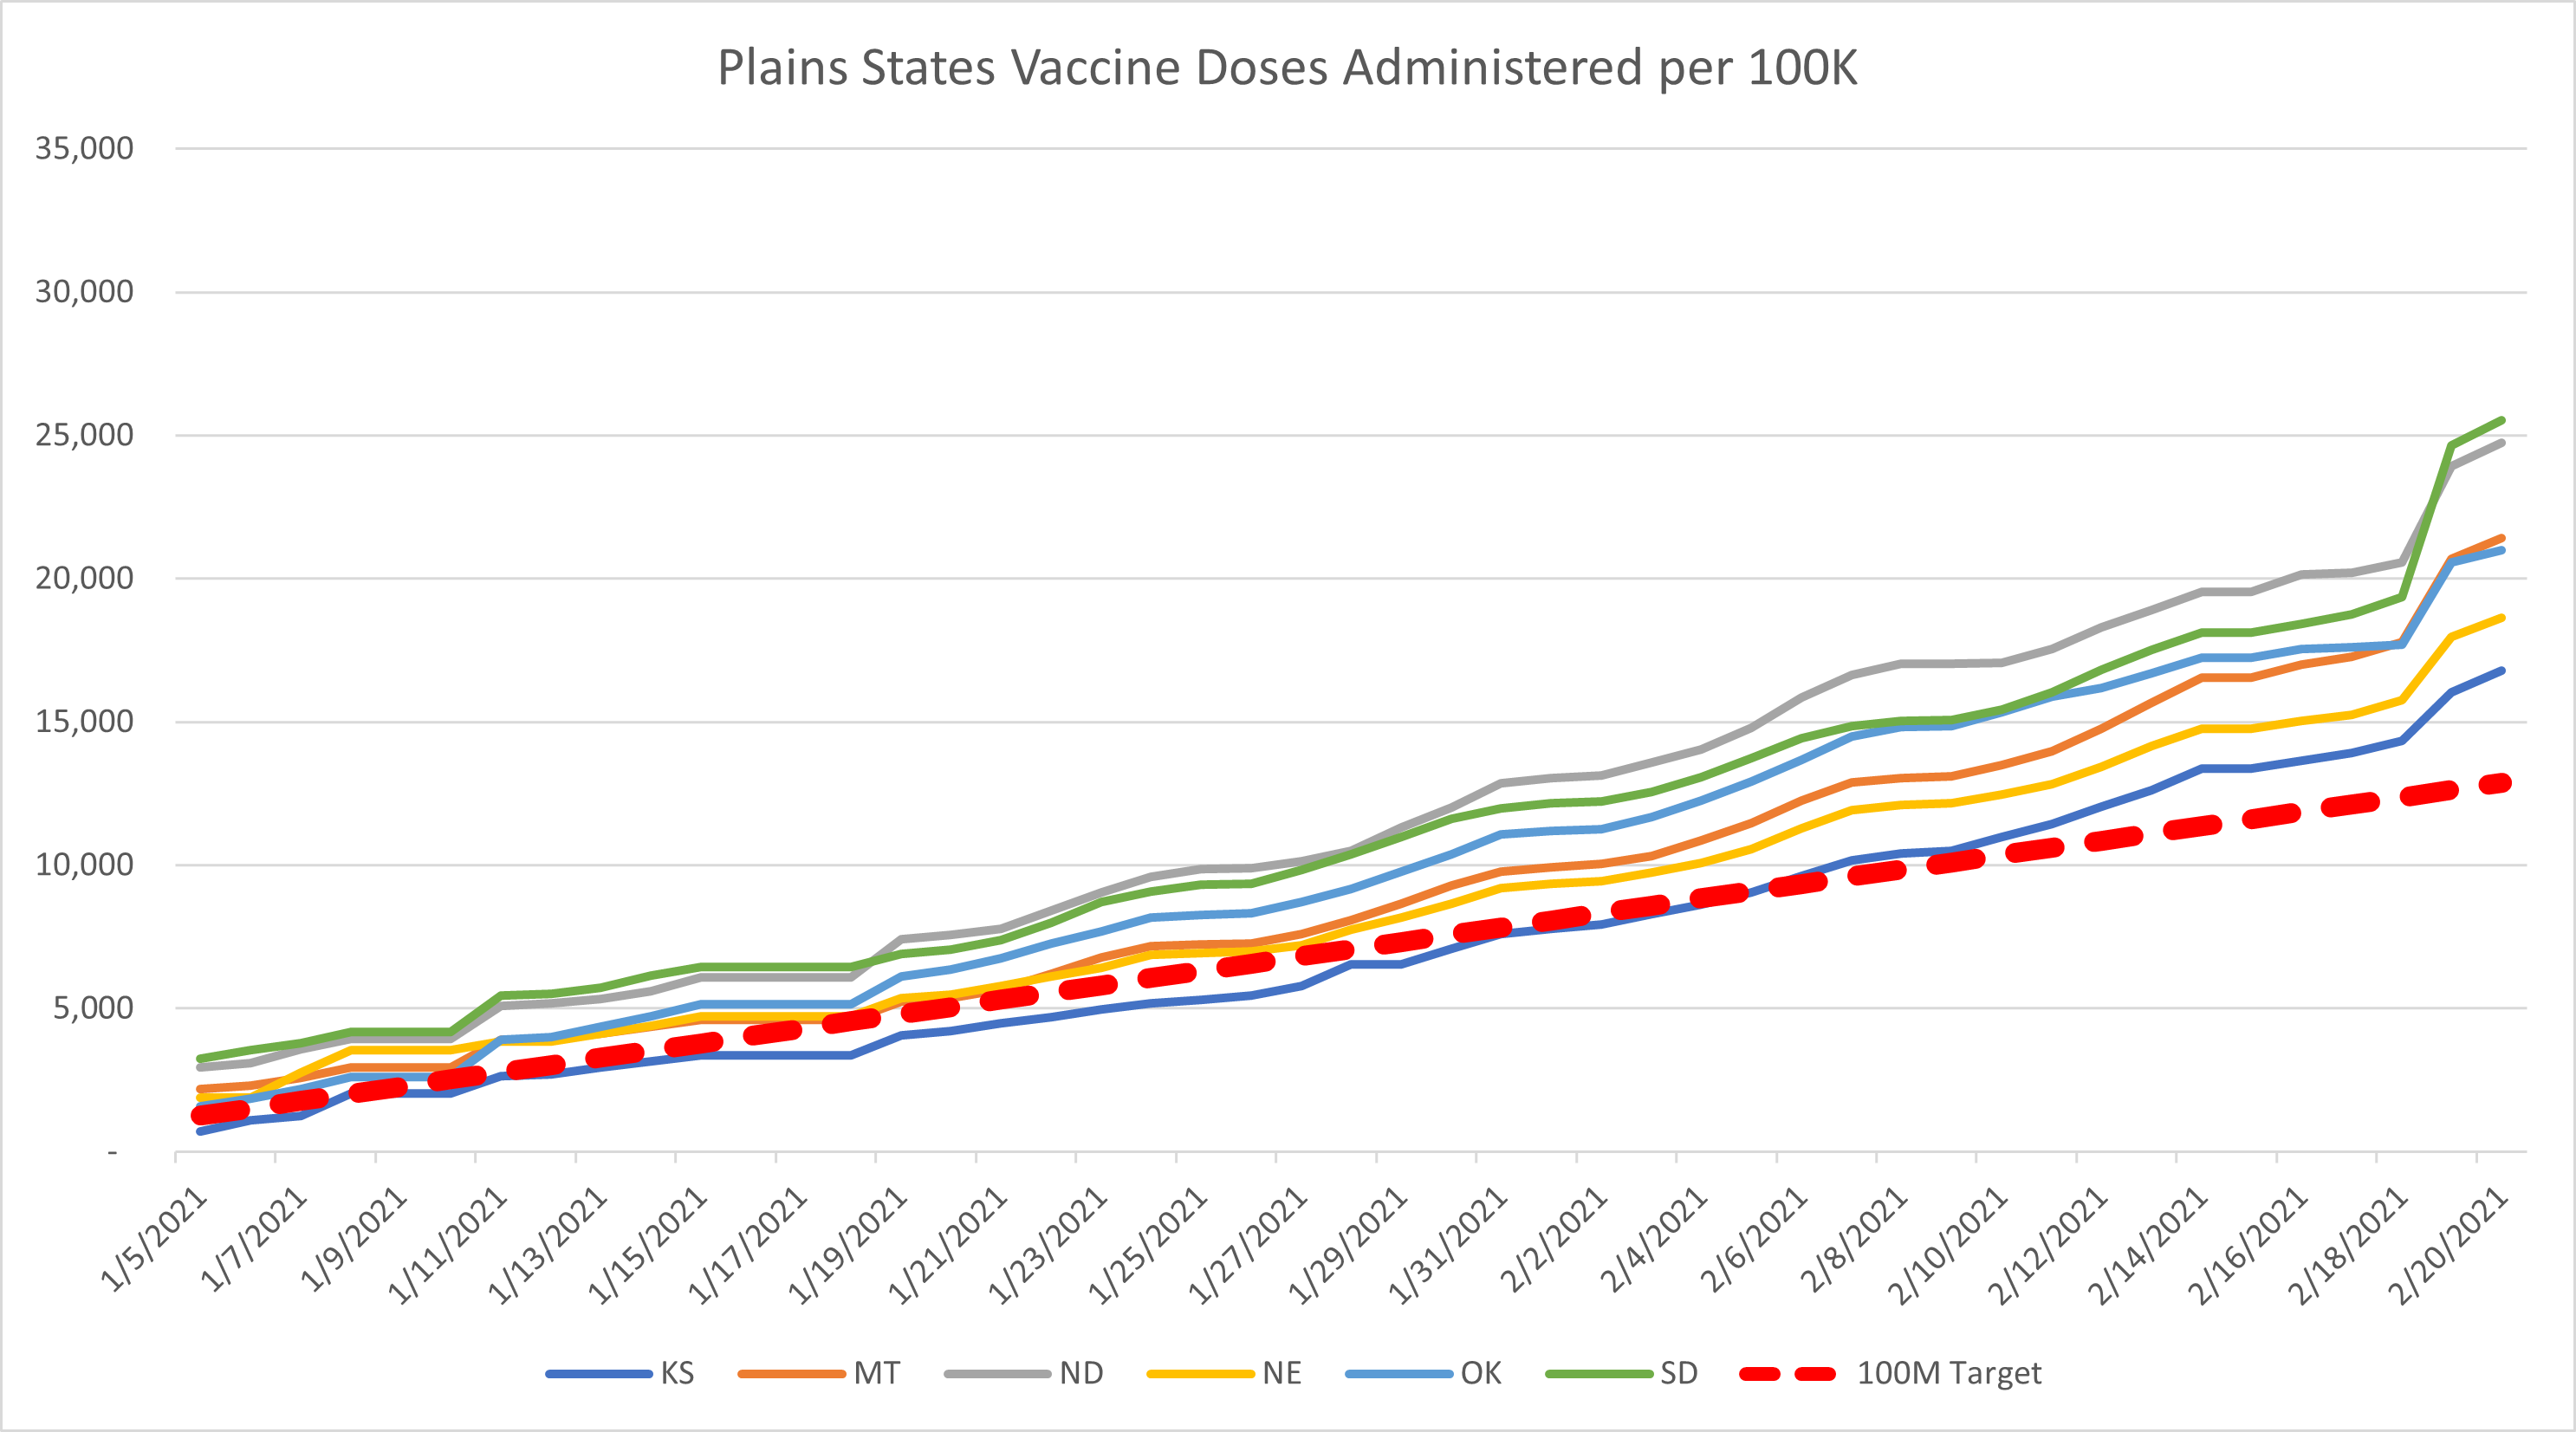
Coming out of a particularly brutal winter, the plains states are doing quite well on vaccines. The Dakotas in particular are getting a lot of shots in arms and that combined with the immunity from the awful outbreaks in October / November should mean that their numbers for next month will stay fairly low.
West Coast
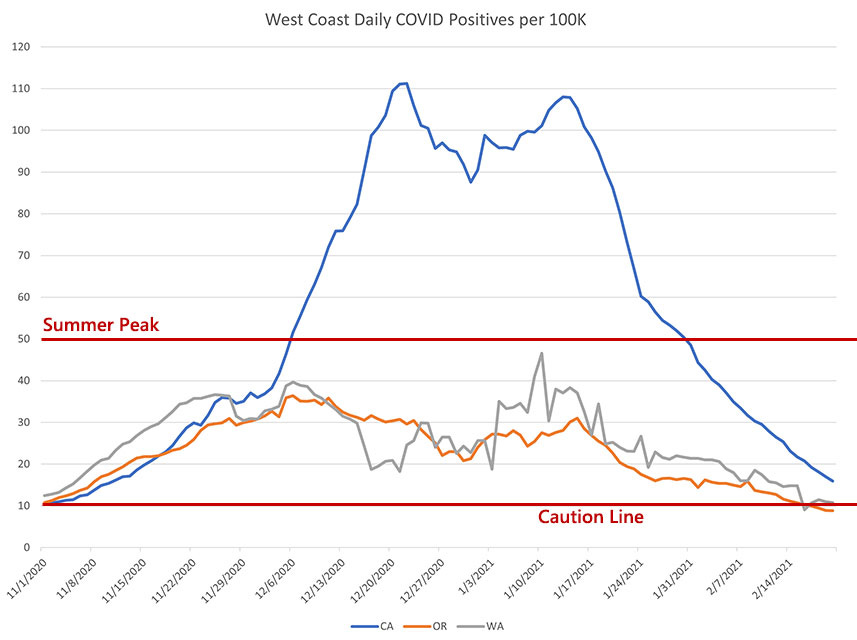
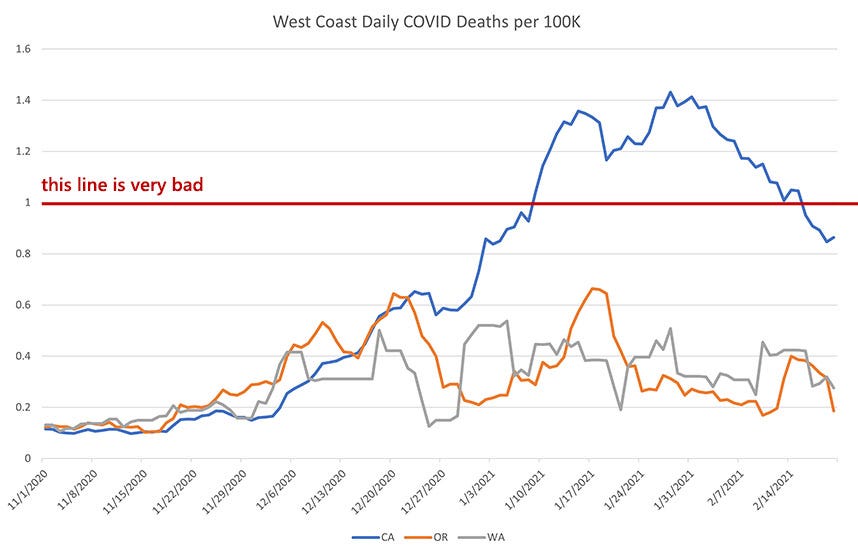
It really does look at this point like Washington and Oregon are largely escaping the worst of this crisis. Yes, they had cases and deaths this winter that approached the summer numbers in the sunbelt, but it seems clear now that the summer surge wasn’t nearly as bad or panic-worthy as we thought at the time.
California is coming down from their winter surge, but things seem to be going relatively well on the west coast, with Oregon even dipping back under the “Caution” line.

It’s interesting to me that, while the west coast seems to have done reasonably well on COVID cases, they aren’t really out-performing on vaccine administration. Even so, they’re well above the 100M target and on a stable trajectory, so that’s good news.
Upper Northeast + Alaska & Hawaii
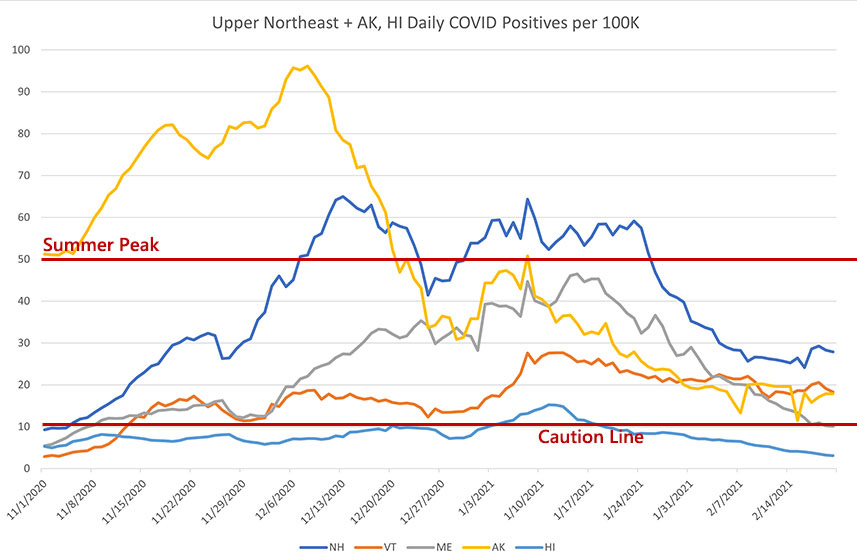
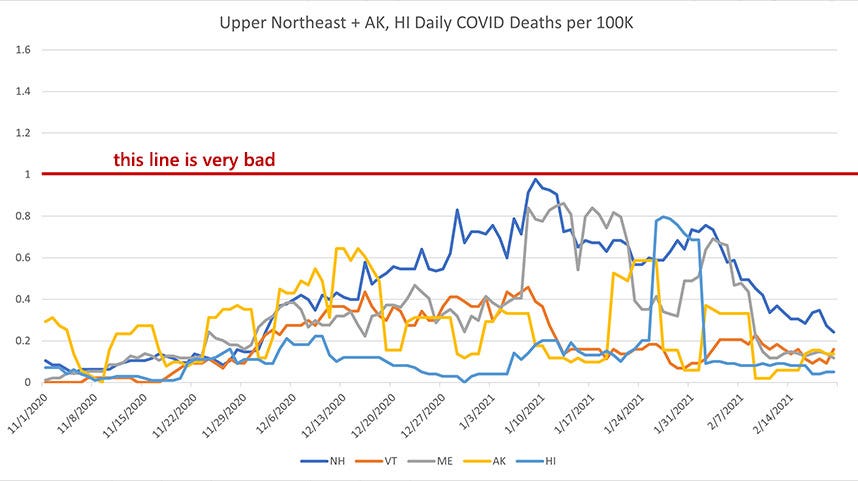
I know it’s not really fair to jumble together the upper northeast with Alaska and Hawaii, but it remains fairly striking how this grouping of states has managed to keep both cases and deaths relatively low. Hawaii, of course, has done that largely with aggressive border management, but there is no border management in New Hampshire, Vermont, and Maine, and they’ve still kept cases and deaths fairly low.
As the winter winds down, it looks like this group of states may end up with some of the best numbers in the country.

Alaska continues to absolutely crush it on vaccine administration. I’m not sure what they are doing that is so effective, but I hope they keep doing it. Which is not to bad-mouth any of the other states in this group, they’re all doing pretty well and making their contribution to the 100 million goal.
Summary
The winter surge was brutal, but it looks to be winding down.
This was the first wave that hit all of the United States at about the same time. I’m odd in that I’m increasingly inclined to view our initial hit in March-May with this virus as a minor success. Consider this chart:

What happened in the northeast a year ago was horrible. But for perspective, you can see that they are the only region that was hit harder in the first wave than in this wave. I chalk most of that up to the fact that the virus was spreading in the northeast for a long time before any interventions or mask-wearing.
But it could have been that bad for everyone and it wasn’t. That’s a small mercy, but one worth calling out.
Looney Tunes: Robin Hood Daffy

This short just thrives on poking Daffy Duck’s ego and self-important personality. Having him play Robin Hood and making the theme of the short his need to prove to Friar Porky that he is the famed outlaw was a great hook on which to string the gags together.
The short plays like a Road Runner cartoon except that there are emotional stakes for Daffy. The gentle ribbing that Porky gives him (believing him to be a traveling jester and not the dashing hero) just serves to amplify Daffy’s desperation. It all escalates right up to the end with Daffy throwing in the towel with a quick, short pun. Classic stuff.
I live in a college town and we are currently experiencing huge case spike due to return of students. Whether or that will translate into hospitalizations or deaths remains to be seen. I’m surprised I haven’t heard more about this in other college towns, could it be what’s happening in Boston?
Good stuff. Thanks!