
Crisis and Control and Playgrounds

The biggest update I have is that the next newsletter (Friday) will be for paid subscribers only. I originally intended for this to just be a free thing, but so many people have signed up to my paid subscription, I feel a deep sense of responsibility to give them their money’s worth.
Every Tuesday will be for everyone, but Friday’s newsletter will be paid subscribers only. You can sign up with a special introductory rate and it comes with a free beer the next time we hang out. If you signed up before this offer, you get 2 beers.
Let’s dig in! In this issue:
Symbols are Reality
Weekly COVID Assessment
Metrics with “X Percent Change”
Resources I’m Watching
Disney Classics: The Pied Poper
Symbols Are Reality
This last Sunday, I went on a walk with my family. There’s a big 10-mile trail that connects Lake Sammamish to Lake Washington, but my kids are 9, 7, and 4 so the most we can do is about 2 miles at a time. We’re on week 3 of this journey, and I love it.
My 4 year old does not. He’s good for about a mile or so but then he runs out of energy and the last chunk of the walks I’m almost literally dragging him. Actually, scratch the “almost” since I have literally dragged him down a trail.
This week, we were very close to the end of our hike when we came across a playground that was not festooned with yellow caution tape. This was stunning. Here in Washington near Seattle, the parks are open but the playgrounds have been locked off with caution tape for almost 3 months. My son has recently lamented the state of things when he wished “The corona-of-iris needs to be closed. I want to play on the slides”. There’s a lot going on in those sentences, but the gist of it is that everything in his life is “closed” and his little heart is tired of it. So the solution is that we close the corona-of-iris.

pictured: my 4 year old’s ideal world, which is why children seem so confused all the time
But this playground we have chanced upon has no caution tape. I’m pretty sure that there has not been any new policy directives about the state of park playgrounds and that it probably should be closed. But I see other kids playing on it and my kids (especially the 4 year old) are just aching to go play. When you’re a child, the caution tape isn’t just a symbol of control and authority, it IS the authority. If the tape is gone, so is the authority.
I let them play on the playground.
As they eagerly climb and slide and swing and spin, I looked to the edge of the play area and see that the caution tape is still here, but pulled from the play structures and thrust into a nearby trashcan. Someone out there thinks that the rules are bullshit and tore down the barrier, the icon of those rules, in a rash and furious rejection of state authority. But also they didn’t want to litter, so they politely placed this symbol for government mandate in a place where a government employee would make sure it is properly disposed of.
The entire episode brings into a stark relief the fact that a given state’s lock-down status isn’t necessarily the best way to gauge the behaviors of the citizens. Lock downs don’t mean anything if people don’t take them seriously. People won’t take them seriously if they are not convinced that the lock-downs are 1) effective and 2) specifically targeted. If it seems like our state governments are simply locking all the things because they can, people are going to push against that. I’m seeing that right now in my deep blue neighborhood. Patience is growing thin. People are willing to sacrifice, but only if that sacrifice is making a difference. If the sacrifice isn’t part of a coherent and proven plan to reduce harm, if it looks more like a form of moral signalling, it’s doomed.
The lock-down on children’s play structures is largely part of a “take every precaution” strategy. People are starting to move past that, growing tired of it. The kids want to play. If there isn’t specific evidence showing the danger of these playgrounds, parents are going to start rebelling. At that point, the state has to choose between punishment for the rebels or just letting them get away with it. The more they get away with it, the less patience the rule-followers have with their increasingly self-imposed stoicism. Self-denial as a large-scale social strategy is plausible if everyone is on board. But it gets a lot harder when 30% of the population says “fuck this” and spends their afternoon bathed in the sound of their children’s rapturous laughter the other 70% has to try to explain to their kids why they can’t go out there and be happy and have fun.
Weekly COVID Assessment
This last week was mostly good news. The COVID hotspots are mostly cooling off and testing is steadily increasing. This last week saw 2.8 million new tests while new cases are holding steady at about 22,000 a day. Deaths are around 1,100 a day but still very unevenly distributed, with the majority of deaths still concentrated in the 10 hardest hit states.
But! Those states are seeing their numbers drop dramatically.
Last week, the three worst areas were New Jersey, Massachusetts, and Connecticut and those are the states that have seen the most dramatic improvements. New Jersey and New York both saw deaths drop 40%, Massachusetts and Connecticut saw 30% declines. This along with the fact that we are seeing only a few alarming increases (I’m worried about Rhode Island and Mississippi) is part of a long road to managing this disease.
But this also gives us a good opportunity to talk about a metric that seems to make sense on the surface, but requires a little more thought than simply running a scripts and plotting the results.
Metrics with “X Percent Change”
We enter the phase of this crisis where some states are getting better, some getting worse. Knowing which direction a state is moving (getting worse? Better? How much? How quickly?) is important as we continue to watch and prevent explosive case scenarios like what we saw in the New York area.
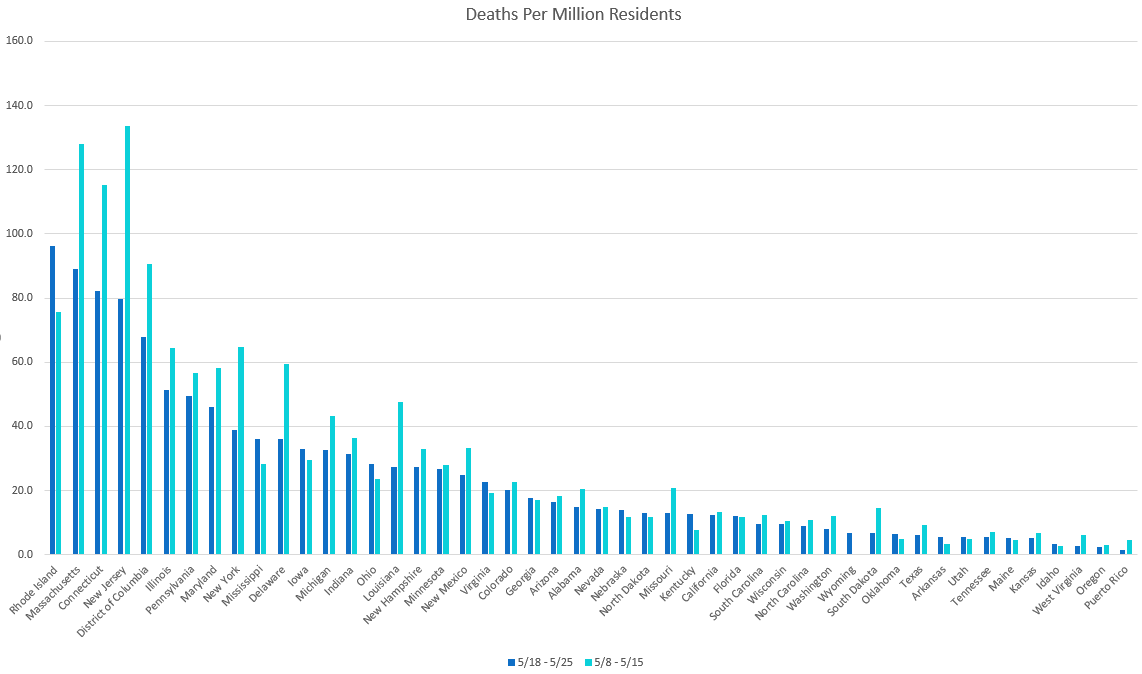
But this metric can be misapplied if we paint with too broad a brush and with too little context. Let me chart the country looking at what states have the best and worst change in daily death rates (comparing the May 8-May 15 period to May 17-May 25).

At first glance, it looks like Arkansas is finally seeing the explosive increases that many have been expecting from a state with few restrictions on commerce or movement.
But if we look a little closer, we discover that in the first period (5/8 - 5/15) Arkansas saw 10 new deaths. And in the second period, they saw 17. Yes, that’s an increase. It’s the biggest *percentage* increase in the country. But because Arkansas has so few cases, this increase could be the result of a single infection point, a prison or a single nursing home. When your numbers are that low, an increase like this could be more noise than signal.
Keep an eye on it, of course, but simply running the numbers through a charting software in this case ends up obscuring more than it informs.
In March and April, as this crisis was moving at 100 miles an hour, it slowly became clear that we were seeing vast differences in how COVID was impacting different regions. At the time, we could learn a lot about state-by-state comparisons. Why was New York getting crushed while Oregon seemed to having things more or less under control?
As we move towards long-term management, even state-by-state comparisons may be too coarse. I recommend that everyone find their own state’s data dashboard and keep an eye on your county. I personally wish we had even more granular data. I deeply suspect that there are parts of my own county that are doing better and worse. As infection rates drop, we’ll end up looking more closely at smaller and smaller communities, trying to identify clusters of infection and isolate them as quickly as possible.
Resources I’m Watching
The Reich Lab Forecast Hub is a great place to see charts of the multiple different COVID-19 forecasts. You can even scan through how the forecasts have changed over the course of the last few months.
Apple is publishing their aggregated mobility data so you can see how the people in your state or county have limited their movement over the last few months.
Disney Classics: The Pied Piper

Watch The Pied Piper on Disney+
This is another part of the early Disney’s early attempts to create these very sumptuous color fairy tales. As this cartoon was being made, Walt Disney was begging to start work on Snow White, his first major full length motion picture. He always loved using Silly Symphonies to explore what was technically possible.
This is a short that would have driven Roy Disney crazy since he handled finances for the studio. The complexity of animation in this short is remarkable for the time. There is rich character animation in both the Pied Piper and the Mayor, several enormously detailed scenes involving crowds of rats, crowds of townsfolk, and crowds of children.
There are great gags of the rats devastating the town, and more for when the children escape the city. The music is simple but joyful and really sets the tenor of the short. And, of course, the moral of the story hinges on broken contracts and dishonest authority figures, which was a particular sticking point for Disney.
Great newsletter. I live in CT near the RI border, just curious what data you are basing your concern about RI on?