
Covid Exposure: The NYC Catastrophe
The catastrophe of Covid in New York City in March-April 2020 was horrific and set the stage for the narratives that would influence Covid policy over the next 2 years

This is the third piece in a review of the early few months of Covid. In a world of dunks and smug hindsight, I’m trying to write down what we were seeing and what we knew in the moment. The first two pieces are here:
What Happened in NYC
It’s difficult to explain exactly how bad things got for New York City in March 2020. The first batch of Covid cases were identified in Seattle but that was largely a factor of the University of Washington researchers going rogue and doing testing that the CDC told them not to do.
But a few weeks into March, it became clear that Covid was not spreading in Seattle in an exponential way. As testing increased, the case positivity rates went down. Case positivity works like this: For every 100 tests you give, if you find 10 positive cases, you have a 10% positivity rate. As we went through March and into April, the state of Washington was seeing case positivity rates sink from 9% to 3%. Seattle simply was not seeing the predicted wildfire Covid scenario. It looked like Seattle (and San Francisco) had, through private and public interventions, “flattened the curve” in line with the conceptual chart the CDC had started promoting.

But this curve flattening was not happening everywhere. I had a good view of this as I was moving Covid data from state health departments into the Covid Tracking Project databases. Cases were rising at an alarming rate in New York City. I was watching this increase on March 14th when I saw this report and said “NYC is in a lot of trouble”

I ended up being right, but probably for the wrong reasons. Here was my thinking: Seattle had shut down, largely through voluntary means. I assumed that this voluntary shut-down was what was keeping our new numbers from exploding. On March 14th, Seattle had 800 Covid cases, which was double what we had on March 10th… but that was almost entirely due to increased testing. Our positivity rate was well below 10%. Only Michigan had more Covid positives that Washington. But I could see from my own experience that Seattle was a ghost town and New York City seemed like it was business as usual.
I now think my logic was flawed. I think I put too much stock into the idea that the people of Seattle had, through their own actions, saved themselves from a Covid surge. But I want to call out my own thinking because it made sense in the context of the “flatten the curve” narrative the CDC was promoting. My observation of the facts on the ground was in line with the public health explanation of what we should be doing.
More importantly, New York City was about to become a warning of what Covid could do and an advertisement for what happens without timely mitigations.
The Scope of the NYC Covid Surge
I remember the shock I felt when I was doing my CTP data updates and saw that Covid cases in New York jumped by over 1000 new cases in one day on March 18th. That was unprecedented, an astonishingly huge number. On the 19th, they rose by 2,000. There were 3,000 new cases on the 20th, which was more cases than Washington had over the entire month. Two days later, it was 5,000 per day. By March 30th, New York was recording over 10,000 new Covid cases every day and the death count was rising quickly.
While the Seattle case positivity rate was under 10%, NYC’s rate was over 30%. Everyone seemed to have this thing and the more they tested, the more they found.
It is hard to give appropriate context for exactly how bad things got in NYC and how quickly. Early in the pandemic, I landed on “excess deaths” as the most reliable metric for measuring the true scale of the pandemic. Cases can depend on testing and reporting. Hospitalization numbers are bound by a lot of factors. But death is death. We have a lot of legal and bureaucratic structure around death and we count it in many ways and for many reasons. You can’t argue with it and you can’t deny it.
The week of April 11th, New York City’s death rate was 642% higher than the expected value. For context, here are some of the “peak excess death rate” numbers during the pandemic for a selected set of other states. Simply put, these numbers represents the worst week for these states in the two and a half years of the pandemic. I’ve annotated them with the date so you can see when each state hit their peak death rate.

As you can see, NYC got his extremely hard extremely early. I’ve included New Jersey in here b/c it was clear that New Jersey’s numbers were a part of the NYC outbreak.
It would be a mistake to look at this chart and conclude that things didn’t get bad for other states. For example, I included Kentucky in this chart because Kentucky had the worst overall Covid fatality rate of any US state.
I’m still not sure why NYC got hit so hard and so fast by Covid. There have been structural explanations such as older housing with shared HVAC systems, heavy use of subterranean public transit, and of course the high density and multi-generational living situations in much of the city. There were also policy mistakes, the most significant of which was Andrew Cuomo’s disastrous order to send infected elderly patients to nursing homes for care. But even this policy error wouldn’t fully explain the scope of infection and death that was seen in NYC and there hasn’t been a good study on the structural explanations that elevates them above speculative pattern-matching.
Five years later and we still have all these unanswered questions about the NYC catastrophe. But in April 2020, we barely even had time to ask these questions. We didn’t know if this was going to be normal for Covid to run wild in this manner or if this was an extreme occurrence. The focus in this piece is to help us remember how this felt *at the time*. We didn’t have the data from 2021. We didn’t know how good or bad this was going to go for other states or cities in an uncertain future.
What we knew at the time is that we had several outbreaks in New York, Michigan, Washington, and California. But if we look at those states alone for March-May of 2020, something becomes very clear.
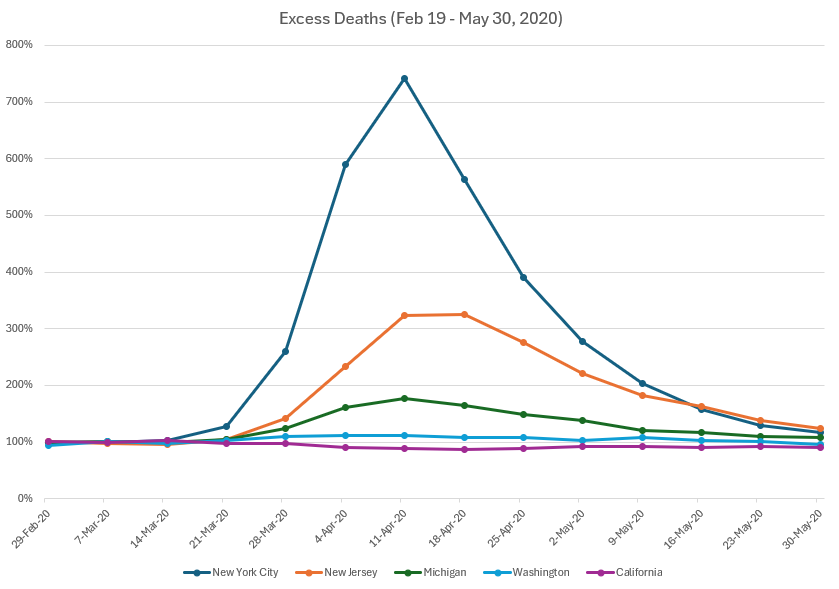
Massive Covid death did not seem inevitable. From this data, with the knowledge we had at that time, it looked like Covid could be held under control. Washington and California managed to do it.
The question we started asking was “Why did Covid explode in NYC, surge dangerously in Michigan, and do basically nothing in Washington or California?” The answers to this question would have long-lasting consequences.
The Narrative Choices
As we watched in horror at the massive spread of disease and death in New York City, a few narratives began to emerge. These narratives are important because they would shape pandemic policy for the next two years.
