Every State's COVID Numbers in Context, September Edition
This is a monthly ongoing series looking at COVID numbers in each and every state across the US. I first did this in July and then again in August and will continue until it no longer makes sense to do it.
One new thing this month is that I put together this chart showing the overall impact of COVID by region. This chart is going to inherently be a bit uneven since the Mountain, Plains states, and Upper NE regions are all pretty small compared to the other regions, which run between 50 million and 72 million in total population. But it’s a pretty good visual summary for how COVID has hit the different regions in the US.

For details to your state, feel free to skip around through this piece:
Midwest (Iowa, Illinois, Indiana, Michigan, Minnesota, Missouri, Ohio, Wisconsin)
Mountain States (Colorado, Idaho, Nevada, Utah, Wyoming)
First Hit (Northeast) States (Connecticut, DC, Delaware, Massachusetts, Maryland, New Jersey, New York, Rhode Island, Pennsylvania)
Southern Border (Alabama, Arizona, California, Florida, Louisiana, Mississippi, New Mexico, Texas)
Mid-South (Arkansas, Georgia, Kentucky, North Carolina, South Carolina, Tennessee, Virginia, West Virginia)
Plain States (Kansas, Montana, North Dakota, Nebraska, Oklahoma, South Dakota)
West Coast (Washington, Oregon, California)
Upper Northeast + Alaska & Hawaii (Vermont, New Hampshire, Maine, Alaska, Hawaii)
Summary
Disney Short: Boat Builder
Midwest
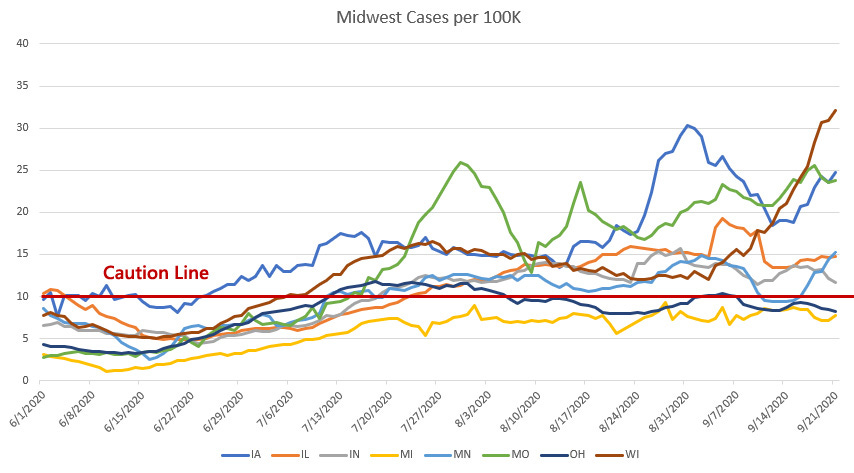

I’ve been seeing people talk about cases rising in the Midwest and that is certainly true. We see it most obviously in Wisconsin but also in the up-and-down variability of Iowa and Missouri. It seems that cases in Wisconsin are rising largely in metros with colleges, but that could simply be all large metros and the fact that they are not rising to such a degree in Illinois seems to be a counter to that explanation of what is happening.
On the other hand, Chicago was hit fairly hard in the early months of this crisis and so perhaps that is why they aren’t seeing the same spikes in cases. On the other hand, Wisconsin has been (and remains) near the lowest in the Midwest in terms of COVID deaths, so it could be that their rise in cases means that the virus is gaining a foothold in a vulnerable population.
Mountain States


Utah remains something of an anomaly among all states in terms of looking at COVID cases-to-deaths ratios. They have been consistently above the 10 cases per 100K caution line for 3 months, but consistently under 0.2 deaths per 100K that entire time, even as Idaho and Nevada have saw deaths rise in correspondence with their case surge.
The most plausible explanation to me is that Utah is the youngest state (the median age is 31) so perhaps their infections have remained largely among resilient groups. The two weeks have seen increases in cases from all these states but nothing that looks to be following an alarming curve.
Northeast States
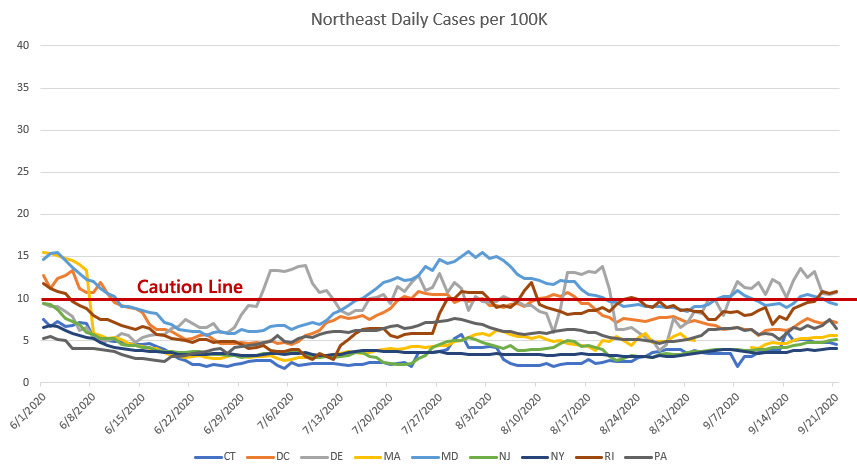

There isn’t much new to say about the northeast since last month. Cases have fallen into a stable plateau for all these states in correspondence to how badly the state was hit by the initial wave. The four hardest hit states (NY, NJ, CT, MA) cluster with around 4-5 cases per 100K and the least hit states (MD, DE) have plateaued around 10 cases.
Of course, nothing is ever allowed to be that simple, so while PA was actually the least hit of all these states, it is still seeing lower case counts and even though RI was hit hard, they are still seeing higher counts. There does not, at this time, seem to be major surges or any states entering a danger zone, which is a deep relief.
Sunbelt States
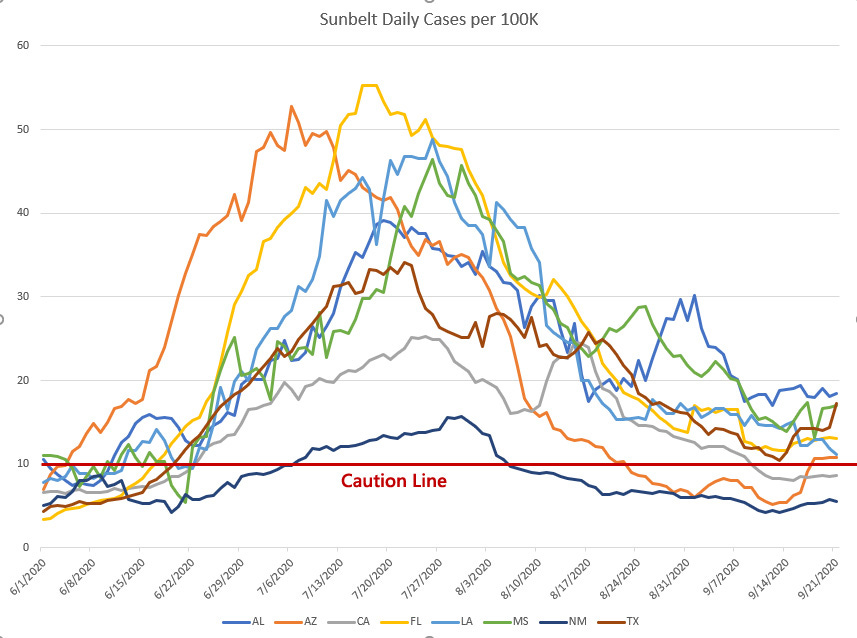

The sun belt state have continued seeing case and death reductions following a truly awful summer. I’m not sure what to make of the recent uptick in cases in Arizona and Texas, but if we are seeing case increases related to students returning to school, that could be the case here.
It’s also worth noting (since it is most obvious here) that there was an huge pause in testing over the entire Labor Day weekend, which made the case counts for the entire country drop for a week and then surge in the two weeks after that. This is the sort of thing that only really becomes obvious several weeks after the fact since looking week by week it’s hard to tell if we’re looking at a reporting surge or a new infections surge or some combination thereof.
Mid South
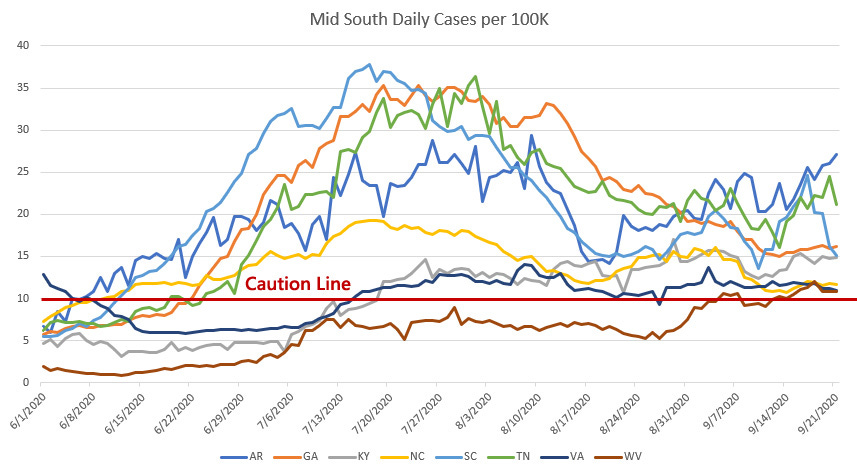

First of all, that death spike from Arkansas, that is the result in a change in death reporting to include over 100 new “probable” deaths since this crisis began. The Virginia surge is a similar reporting artifact where the dip in deaths in early September is offset by a surge in the last week.
Though cases and deaths are down from their peak, they remain stubbornly high. We would like to see cases fall back down below the 10 cases per 100K caution line, but outside of South Carolina and a few metros in Georgia, COVID has not hit this region with anything like the ferocity that it hit the Northeast nor the clean and clear wave that hit the sunbelt states. This seems to be a pattern for areas with medium-sized cities and suburban metros. They see neither the dangerous exponential surges nor the comforting long-term case depressions.
Plains States
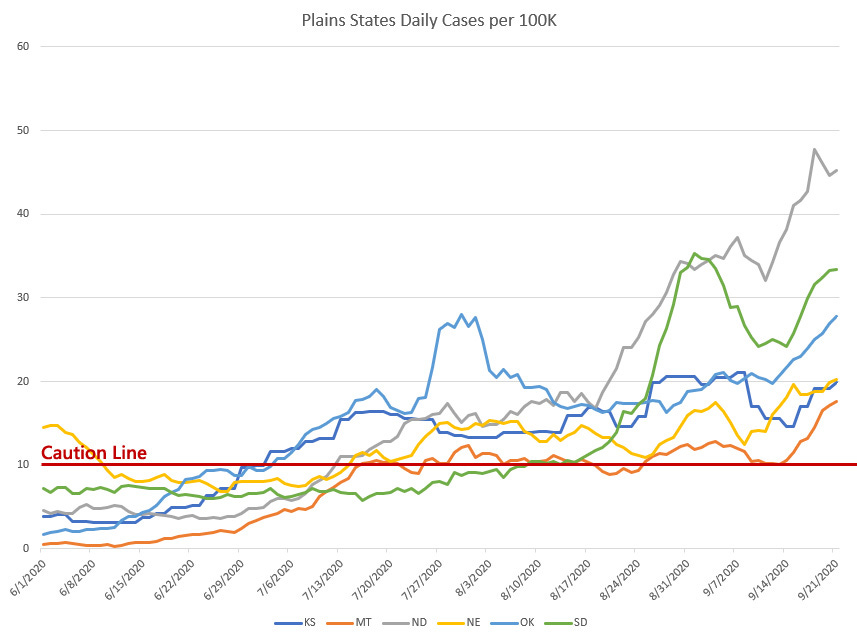

I was surprised to see that cases have risen so high in the Dakotas. There was almost no hint of this at this time last month, which is a testament to how quickly things can spread. After such a long time with consistently low cases and deaths, North and South Dakota are seeing what I would consider to be a serious case spike. We are seeing another case surge in Oklahoma, but it’s worth noting that OK has seen spikes before without an alarming surge in deaths.
We can hope to see the same, hope that the case surge will not result in a worrying death surge, but the cases per 100K do seem very high… higher than we’ve ever seen a surge that *didn’t* result in a surge in deaths.
West Coast
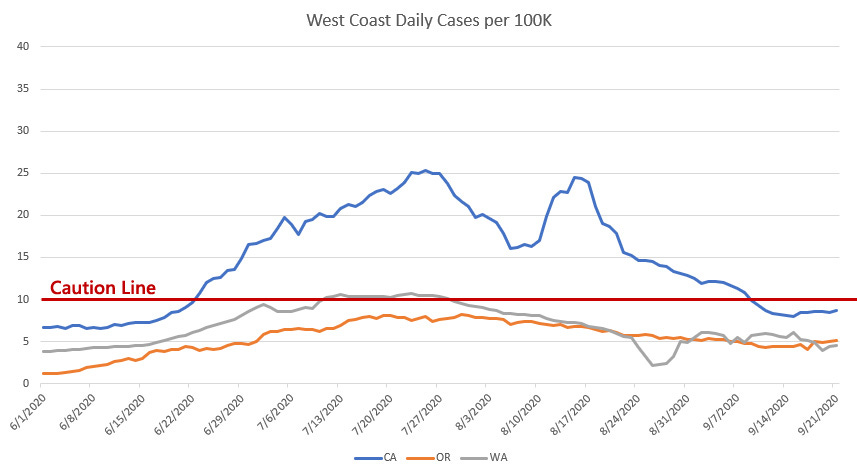

The west coast remains a bit of a strange place in terms of COVID numbers. We were expecting very high spread at the beginning of this crisis and it has just never materialized. Despite protests and high-density metros, cases and deaths have remained low. Even the surge in cases and deaths in California are largely concentrated in the southern part of the state.
This could be attributable to personal caution as people remain *extremely* cautious in my Seattle suburb. Perhaps it is attributable to lock down as all of our opening plans in Washington seem completely stalled to the frustration of many businesses and residents. But for whatever reason, the Pacific Northwest in particular has weathered this crisis fairly well and there is little sign of upcoming surges.
Upper Northeast + Alaska & Hawaii


The upper northeast (NH, VT, ME) remains largely unaffected, especially considering how hard Massachusetts has been hit. We can see that Alaska finally saw their first real outbreak in July and Hawaii in August. Both these outbreaks resulted in small increases in deaths, but the total death counts in both these states are small enough that even handful of deaths from a nursing home or individual hospital may look like a surge.
Summary
There isn’t a great deal of “new” news around COVID and any individual states or regions. The tail on deaths seems excruciatingly long, but that could be due to the fact that I’ve been following it so closely. I also think this is a valuable chart showing how regional the COVID impact has been through these months.
I’m not yet convinced that we are in for an inevitable fall wave that would mirror what we are seeing in Europe. At least we haven’t seen any clean and clear signs of that.
My hope and expectation is that we will see daily deaths fall by 30% by the time I do this again in October. That would still be almost 500 deaths per day, but it would also mean we’ve matched the low point in death reporting from late June.
We’ll have to keep an eye on Europe to see how they fare with the latest resurgence and then feel our way through this for as long as we must.
At least I don’t have to pay attention to the election.
Disney Shorts: Boat Builders

Mickey, Donald, and Goofy receive a mail-order boat-in-a-box. This highlights a common theme in the early Disney shorts, which is the intersection of automation, modern invention, and how they influence and impact the “common man” (or, I suppose, the common mouse).
It ends in disaster, of course, but it’s the journey that is really engaging. There’s a certain endearing anticipation of disaster in watching over-confident amateurs attempt what is clearly meant to be a skilled task.
Even more so when two of those amateurs are Goofy and Donald Duck.
The gags are thick on the ground and a decent amount of fun. It’s a tight little short.


Lots of new cases, but deaths mostly falling. And excess deaths year-on year near zero. Time to relax all restrictions.
Thanks for the newsletter as always. These case counts are being used for travel restrictions (or more specifically a 7 day average of new cases per 100,000 people), and I can't seem to find how the states are coming up with the numbers (NY & DC - 10 per 100,000; Chicago/CookCounty - 15 per 100,000; MA - 6; NM - 8; OH & KY - states with 15% positivity rate; not an exhaustive list). I can't find anywhere on the internet where these numbers are coming from. What am I missing?