
Every State's COVID Numbers in Context, November Edition
Not great, Bob.

This is part of an ongoing monthly series in which I try to look at every state and how they are doing in regards to COVID positives and deaths.
I normally would have done this post next week, but the situation is dire enough that I thought it should get out early. The short version is that things are *very* bad all over the country. In fact, things are bad enough that I had to re-align the y-axis on my charts. In previous posts, the standard y-axis went up to 40 daily cases per 100K population and then I would resize an individual chart if cases went over 40. Here’s an example of the summer surge in the southern states using the old y-axis.
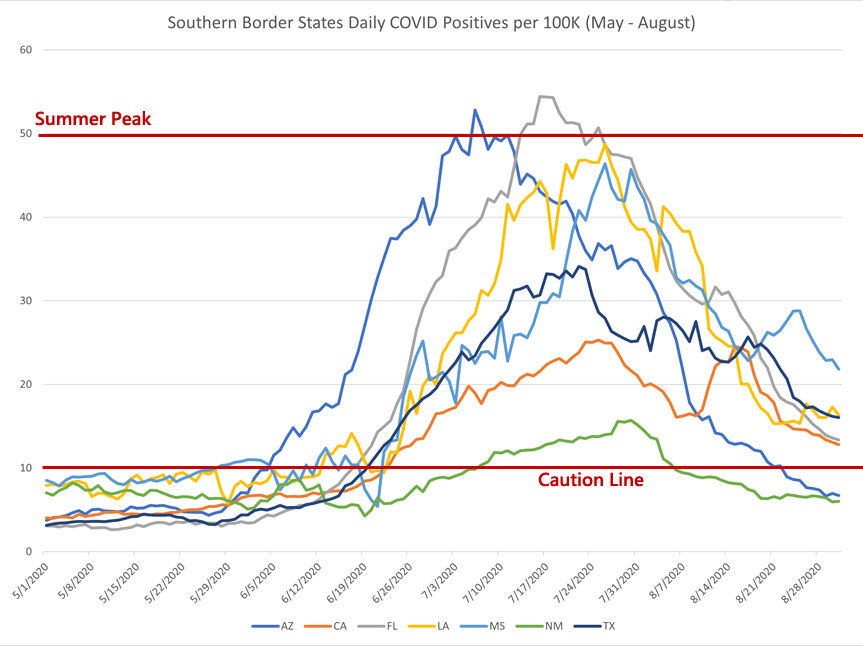
During the summer, the states that had the worst outbreaks peaked at about 50 positives per 100K population. To help keep perspective, I’ve added a line indicating that to every new chart. But in the last month cases have surged as high as 180 daily positives per 100K. Using the old y-axis, I literally couldn’t fit that chart on the page. So I compressed the y-axis and now the “standard” chart goes up to 80 cases per 100K and I resize the charts for regions that go higher than that. With that in mind, this is how the data above looks with the new alignment.

I could talk for a very long time about what this means and the visual impact of compressing the y-axis and how the way we look at data impacts our judgement of a given situation. That’s all very interesting stuff and chart design is certainly an art that can be used to encourage people to come to a specific conclusion. But the reason I’ve done it is more simplistic: I want the graphs to all be on the same scale and I want them to be readable.
So, how are things going?

Here is what is going on with COVID this month:
Midwest (Iowa, Illinois, Indiana, Michigan, Minnesota, Missouri, Ohio, Wisconsin)
Mountain States (Colorado, Idaho, Nevada, Utah, Wyoming)
Northeast States (Connecticut, DC, Delaware, Massachusetts, Maryland, New Jersey, New York, Rhode Island, Pennsylvania)
Southern Border (Alabama, Arizona, California, Florida, Louisiana, Mississippi, New Mexico, Texas)
Mid-South (Arkansas, Georgia, Kentucky, North Carolina, South Carolina, Tennessee, Virginia, West Virginia)
Plain States (Kansas, Montana, North Dakota, Nebraska, Oklahoma, South Dakota)
West Coast (Washington, Oregon, California)
Upper Northeast + Alaska & Hawaii (Vermont, New Hampshire, Maine, Alaska, Hawaii)
Summary (Should I Do Thanksgiving)
Disney Shorts: Mickey’s Grand Opera
Midwest
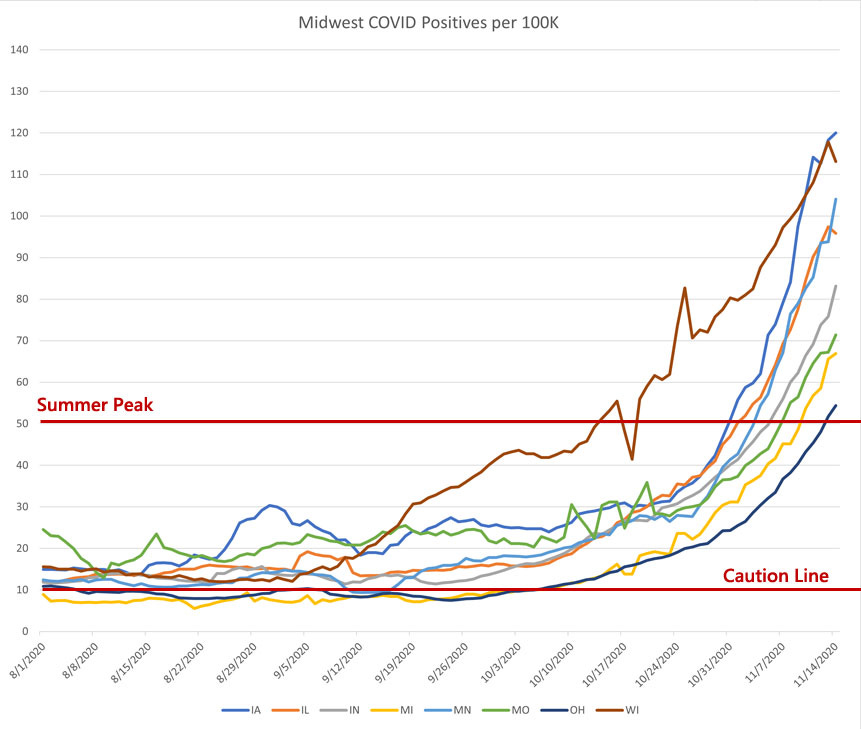
In the last summary (Oct 21st) we could pretty clearly see that Wisconsin was spiking and in pretty serious trouble. I fully expected, based on our experience watching the surges in the south during the summer, that they would peak in the 60-80 range. But here we are 4 weeks later and not only has Wisconsin sky-rocketed up to almost 120 daily cases per 100K, but the *best* Midwest state is where the worst one was last month.
Most of the states in this region look like they are in an absolutely textbook pandemic curve. We can hope that they are near a peak, but there is no real knowing at this point. I don’t know how high these cases can go. I don’t think I’ve seen any country in Europe go over 200 daily cases per 100K population, but the data integrity out of Europe is choppy at best and it’s foolish to make predictions at this stage.
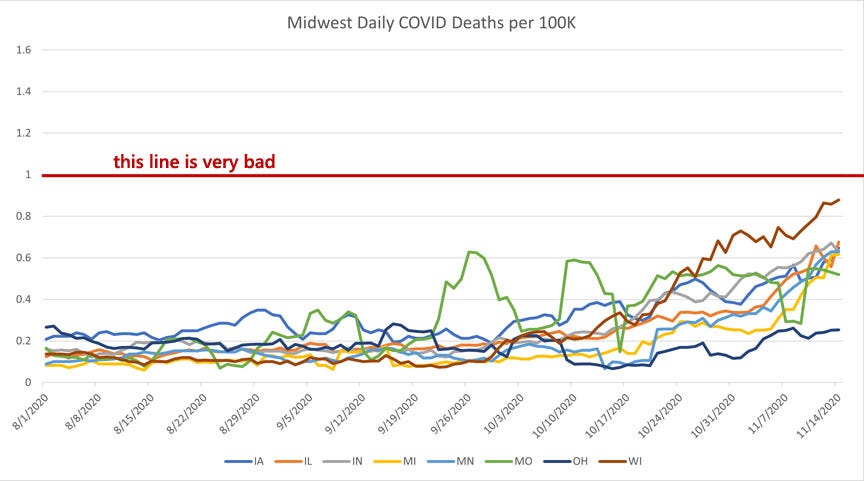
The only bright side is that Wisconsin’s deaths are, quite frankly, lower than I would have expected from the case data we saw at this time last month. We should be prepared to see deaths rising (likely above the “very bad” line) in all of these states in the coming weeks.
Mountain States
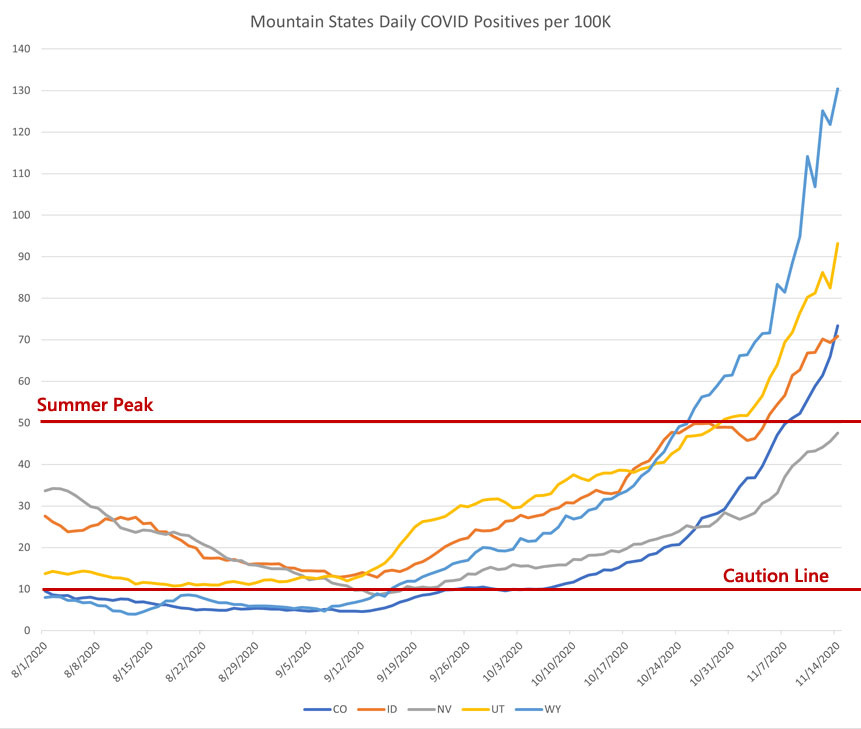
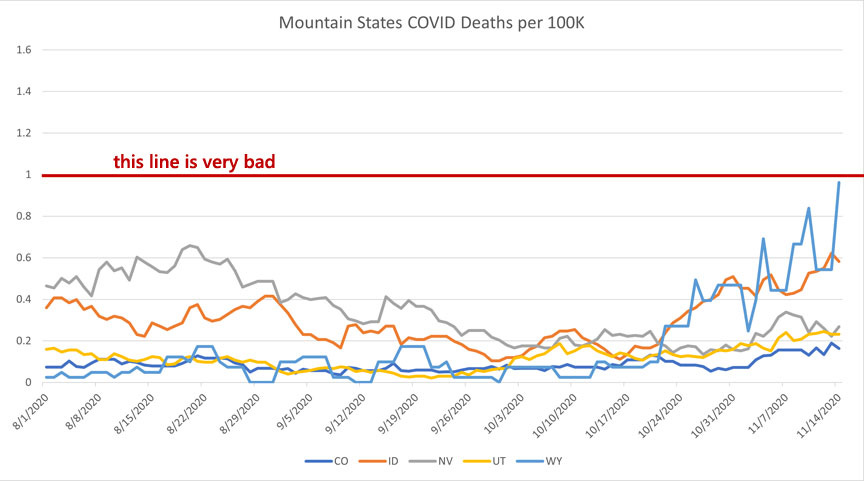
The mountain states had been pretty good for some time. Nevada and Idaho had a bit of a rocky summer and Utah’s positive numbers kept flirting with a danger zone but never really spiking and deaths remained pretty low.
But these numbers are bad. All these states are following a classic pandemic curve, they are just at different points on it. There is still a fairly open question of exactly how much of an impact these many cases are going to have on hospitals and the death rate. To be frank, I expected to see more of a deaths rise than we have so far seen in the mountain states. We know from experience that those numbers are going to rise, but there is still a bit of hope that maybe the rise won’t be as bad as the current positive numbers suggest.
Northeast States
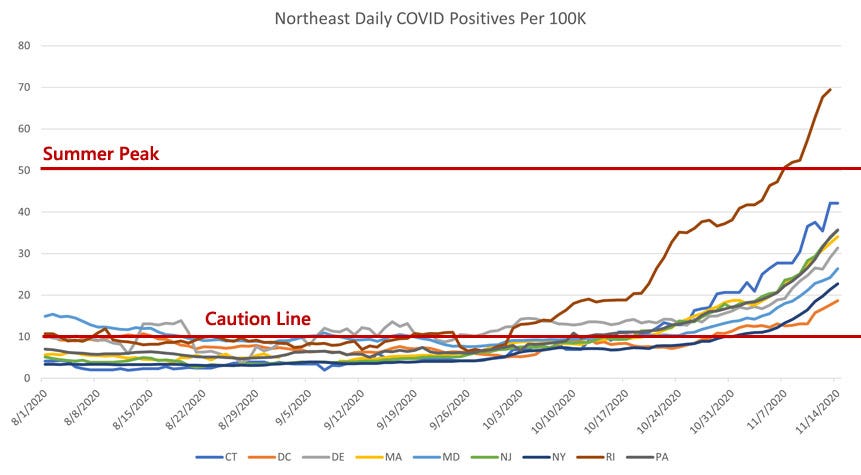
The optimist in me says that maybe the Northeast can mitigate the curve that we’re starting to see. Watching an entire region increase cases in near-unison reminds me of the early summer when we were watching all the southern border states increase together even though they spanned thousands of miles, hundreds of communities, and a wide range of different mitigation policies.
It would not surprise me if the Northeast is heading into the same kind of classic pandemic curve that we are seeing in so many other states. This will be a good chance to see if policy mitigations make a big difference. New York is locking things down and if those lockdowns are successful at bending the curve, we should be able to see that in the data next month.
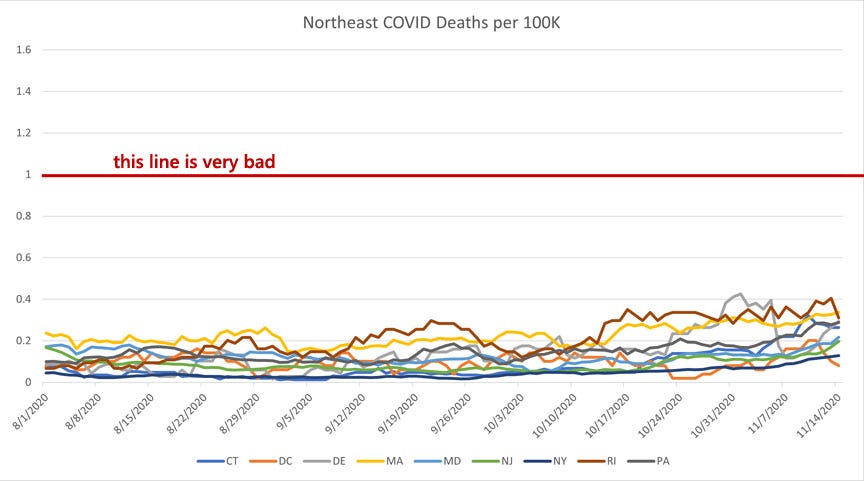
With deaths, it is still too early to see the numbers from the positives showing up substantially in the deaths number. But unless these curves bend very soon, we will expect to see more deaths this time next month.
Southern Border
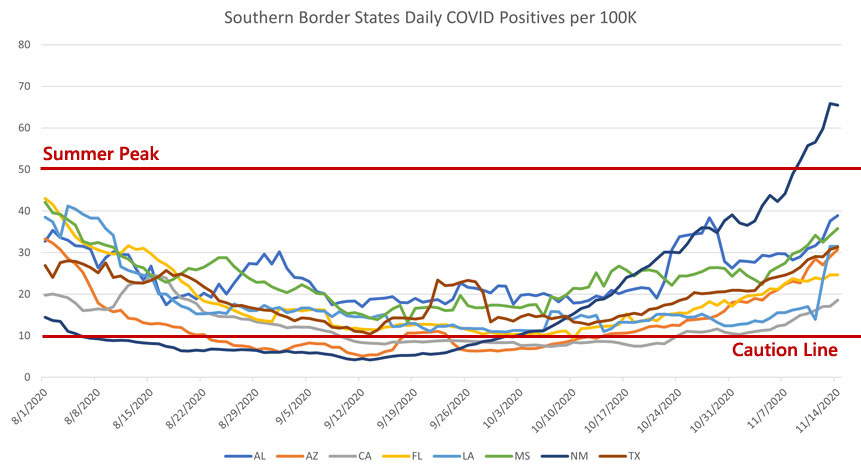
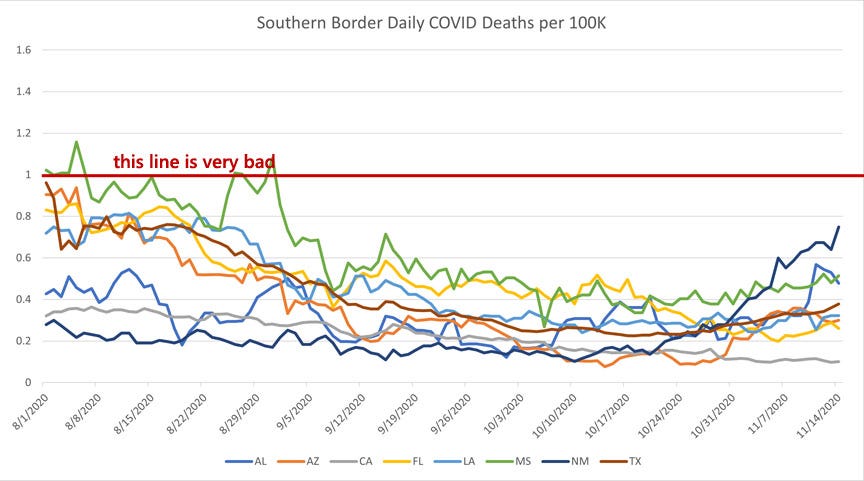
It looks like the southern border states probably hit a nadir of cases in September. These states are a little harder to gauge because the trend lines are not very smooth and they have recently managed a serious surge and have worked through months with cases at what I would call a “high valley”. We’re seeing the possibility of the beginnings of a pandemic curve in most of these states, but the data is honestly so noisy and so early that I’m not at all confident saying that is what is happening.
The big worry point right now is New Mexico. New Mexico was the only state in this group that managed to avoid the summer surge, which made many people think that they avoided it though a combination of good policy and a culture of caution. The fact that they’re seeing a spike now that is bigger than any of these other states during the summer is a classic example of why I’m skeptical about crediting policy to low COVID numbers. If we assume that policy gave New Mexico low numbers in the summer, we have to explain why those same policies are giving them even worse numbers now.
Mid-South
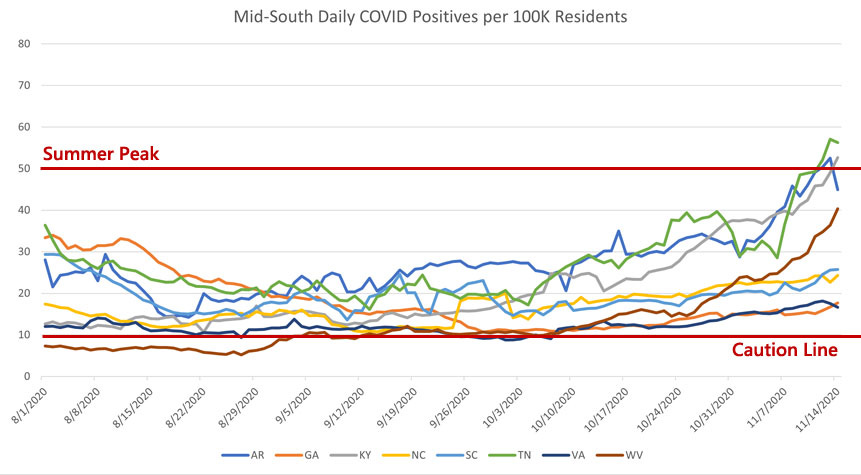

The “mid south” is probably my worst attempt at grouping states into a region. The variability within this region has always been pretty large and the numbers are all over the place right now, which makes it difficult to talk about as a region.
Let’s start with Kentucky, which I’ve hardly mentioned at all in the entire time I’ve been doing this. Kentucky has been a bright point in this region for the whole year. They’ve never had a major surge or worrying numbers. But they do now. I don’t say this to pick on them (not at all! Bravo to them for keeping their infections so low for so long!) but to point out that their case surge right now is effectively their first wave.
That is something that has been very strange about this month’s data. The states that managed to avoid COVID with the best numbers from March until October are suddenly the states with the worst numbers. This is the case with Wisconsin, with New Mexico, with Kentucky, with Wyoming, and we’ll see in the next section that it’s the case with the Plains states as well.
Even so, Virginia has managed to keep things low and is still not seeing any spikes. Bravo to them for that, let’s hope it lasts.
Plain States
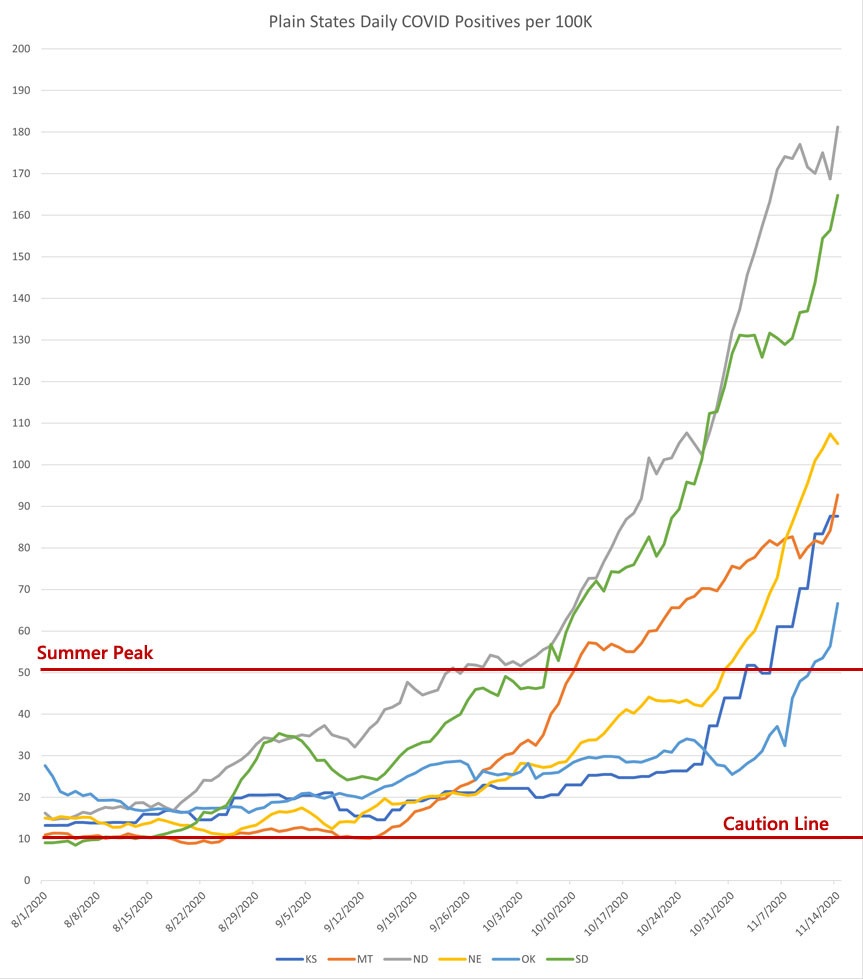
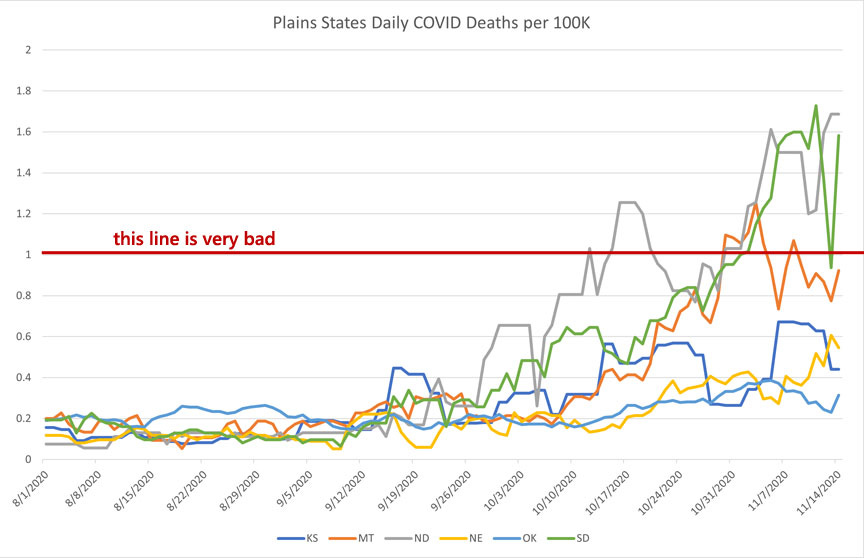
What the hell happened here? Up until September, the plains states had managed to almost entirely avoid COVID. Cases were low, deaths were low, there was never a major spike.
Then *something* happened and the plains states are seeing the worst positivity numbers in the country by a wide margin. This is another example where the states that had seen the best numbers until September (Montana, North Dakota, South Dakota) are seeing the worst ones and the states that saw the worst numbers in the summer (Oklahoma by a wide margin) are seeing the best numbers. This pattern is annoyingly consistent, which is why I’m so stubbornly skeptical that policy mitigations are the variable that controls COVID numbers.
West Coast
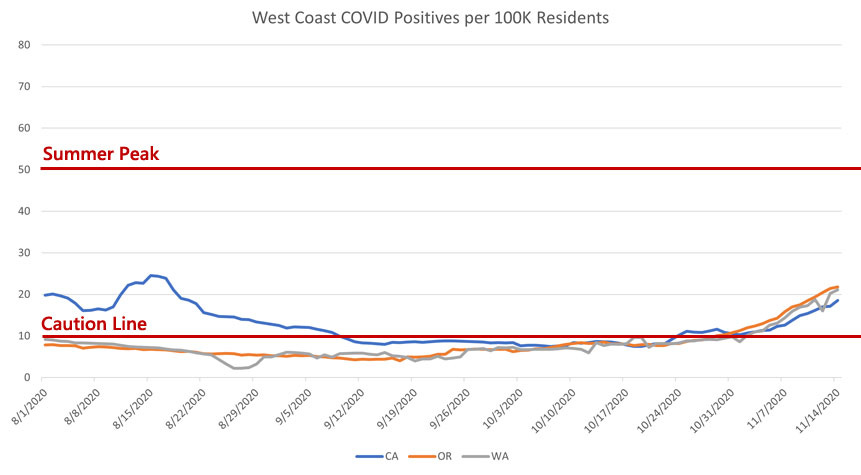
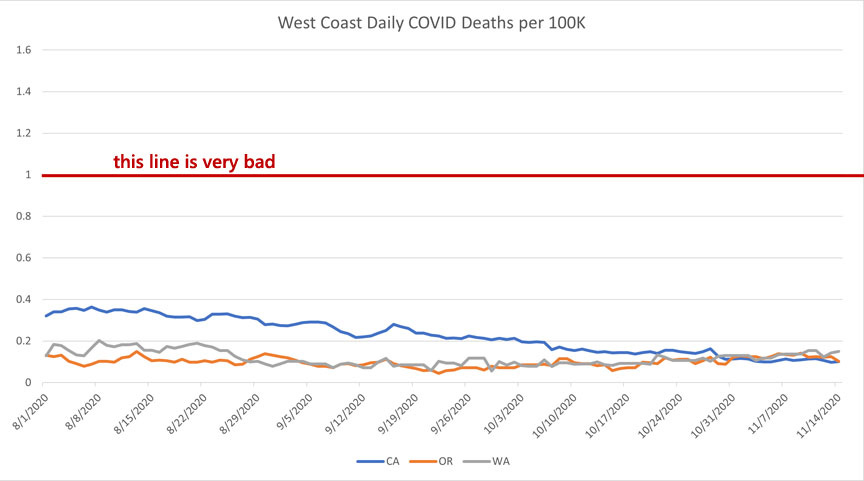
The west coast is by far the quietest region in the US. They got COVID under control in the spring, they kept it low during the summer, and now they are seeing cases rise but the curve is far from exponential (yet).
This will be another region (along with the Northeast) where we can see if policy mitigates the infection curve. Washington has just entered a 4 week lock down; Oregon has started a two week freeze. If these mitigations can be successful, this region is where we’re most likely to see that success.
Speaking from some experience, many Washingtonians are following guidelines on masking, social distancing, and avoiding indoor spaces in a draconian way. It is one of the things that has most convinced me that the voluntary culture of a region has more impact on COVID spread than any of the top-down policy implementations.
Upper Northeast + Alaska & Hawaii

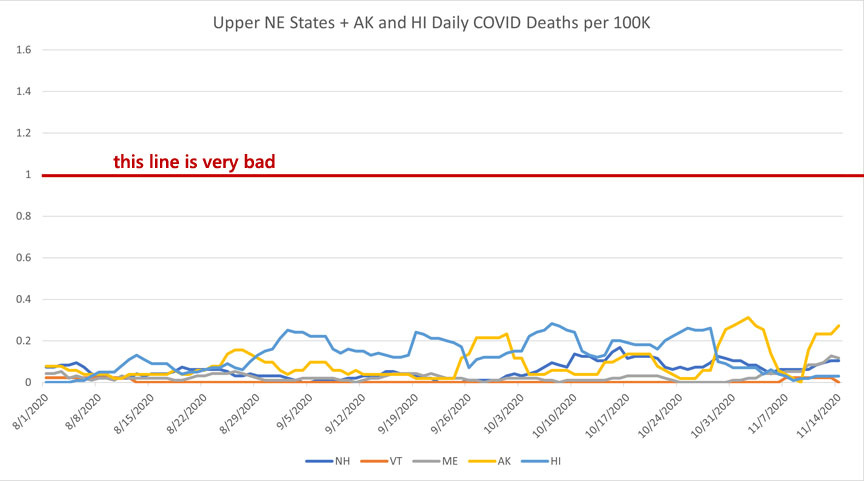
The upper northeast has managed to weather this crisis fairly well through a combination of travel restrictions and simply being further out of the way. The surge in Alaska is fairly severe and we can see the first hints of New Hampshire and Vermont following a path similar to their neighbors in the northeast.
But Hawaii’s strategy of strict border control, ubiquitous testing (with trusted partners only), and heavy-handed quarantine seems to be effective at keeping positive cases at bay. This is a pattern we’ve seen along the pacific rim & it seems to be the only really effective medium-term COVID mitigation strategy.
It is, of course, not a long term strategy. The only long term strategy is a vaccine.
Summary (Should I Do Thanksgiving?)
The quick summary is things are very bad in a lot of places right now. The Midwest, Plains, and Mountain states are all in the very middle of a raging pandemic outbreak. The Northeast and several states in the Mid-South and Southern Border look like they might well be on the cusp of another outbreak.
I get a lot of people asking me for advice on what to do when it comes to Thanksgiving. My awful answer is that the entire point of me doing these summaries is to try to give people enough information to make their own decisions.
It is undeniable that large family-based functions have been identified as points of COVID spread. Families tend to be a bit more intimate with each other, less careful around each other. Know from the get-go that this is a medium-to-high risk activity.
I think a government mandated anti-Thanksgiving lockdown is largely pointless. The sort of people who are inclined to listed to that edict were probably going to cancel Thanksgiving anyway and there is a certain segment of the population who, upon hearing the government telling them not to do something, will immediately make it a point of pride to do it. Welcome to America.
My recommendation is this: Use your judgement and be flexible.
Maybe have Thanksgiving on a Saturday & ask everyone to self-isolate for a few days before they come over. Look into getting a COVID test this weekend & do as little as possibly to reduce the chance of catching it in the meantime. Do *not* go to a big family celebration if you have any symptoms. Take your own temperature before you go inside. If your family is up for it, take everyone’s temperature as a precaution. Think about possible activities that can be done outdoors.
You could do some or all of these things. Every precaution you take helps a little bit. None of them are foolproof, but the only thing that is foolproof is to have zero personal contact with anyone. Family and friends are important and holidays are a time to remind ourselves of that. If having a big family get-together fills you with dread or fear, then don’t do it. Mitigate what you can, check the numbers in your area, and listen to your own sense of caution.
Disney Shorts: Mickey’s Grand Opera
This is a classic. As it starts out, you think it’s going to be another performance-based musical piece, but it quickly turns into something else as Pluto discovers a magical hat that plays tricks on him.
That is one of the two plots in this short. The other one is what you would expect, Mickey conducting an orchestral opera featuring Donald Duck and Clara Cluck. Of course these two gag-filled stories intersect and it’s delightful.
This isn’t as funny and gag-filled as the best in the “classical music put to goofy cartoon” genre (that would be “Rabbit of Seville”), but it’s also an early participant. And we get to see the animators really start to give Donald a little more personality (this is still within the first two years of Donald’s debut).
One of the things I am interested in is how things change from wave to wave within each state. I am in Cincinnati, OH and Ohio seems to be having it's first really strong wave. It's obviously not all due to testing because our hospitalizations are higher than they have been. But in Hamilton County, our 7 day moving average for new hospitalizations topped out on November 3rd at the same number it did during our summer spike. The 7 day moving average for cases has been above our summer spike for over a month now and is almost 5x as high. I understand hospitalizations and deaths lag, but it seems like we should have seen some movement by now unless: 1) testing was atrocious even in July or 2) there is something "different" in how waves hit a population.
I don't mean "different" in a conspiratorial sort of way, more that it seems like the pattern we see is high density cities being hit first, then the suburbs, then the more rural areas. As the waves come back in the areas that have been hit, even with increasing case numbers, the population susceptible to serious complications seems to decrease.
The other frustrating thing is that comparing cases across waves seems extremely futile given the rapid increase in testing.
I live in Albuquerque and agree with CSF's description and analysis. The NM Health Dept's R0 and ICU numbers peaked in late Oct, early Nov and are currently almost at or near their gating criteria. CDC excess death has been below their high line for a while too (as of 10/31); the non-C19 numbers seemingly have exceeded C19 since June. (I post that data: https://paunchy.substack.com/p/363d7cd6-b9ef-4f58-9544-470f4ea9eafe)