Every State's COVID Numbers In Context, Sept 2021
The summer COVID surge retreats, with no obvious candidates for the next surge making themselves known.
Throughout the pandemic, I’ve been trying to build tools for looking at COVID data. If you are way into that sort of thing, check out my github. I have one project called covid-sharp that is a tool for gathering and processing data from the various data sources. I just recently updated it to gather county-by-county COVID data from the New York Times. If you’re only interested in the data after it’s been processed, you can check out my polimath-covid repository, which is the result of the data after I’ve processed it.
I bring this up because a friend recently asked if it was possible to create an animated map county-by-county of COVID rates across the country and it turns out that it is possible. Warning: that link points to a very very large webpage (almost 200 MB) because that is the only way I was able to do this. Yes, I know Nebraska looks weird; that is because Nebraska no longer reports cases county-by-county.
The overall COVID picture this month is that it is improving. The summer surge is receding and we aren’t yet seeing what I would consider to be the beginnings of a winter surge. My optimistic side suggests that maybe we won’t have a winter surge due to high vaccination rates but that may be wishful thinking.
Just to get this out of the way: the reporting pause on the Labor Day holiday is what is causing that weird little dip and spike in the data in September. We see this across most states.
For the moment, let’s just look at the numbers as they stand.
Midwest (Iowa, Illinois, Indiana, Michigan, Minnesota, Missouri, Ohio, Wisconsin)
Mountain States (Colorado, Idaho, Nevada, Utah, Wyoming)
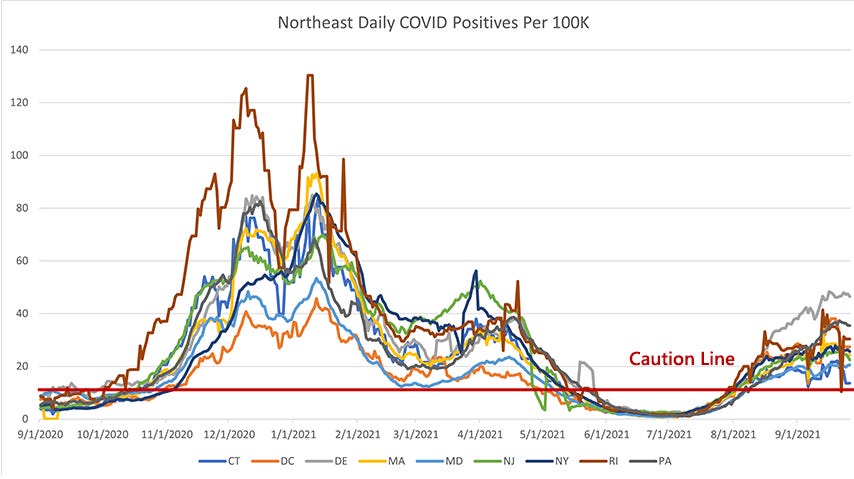
Northeast (Connecticut, DC, Delaware, Massachusetts, Maryland, New Jersey, New York, Rhode Island, Pennsylvania)
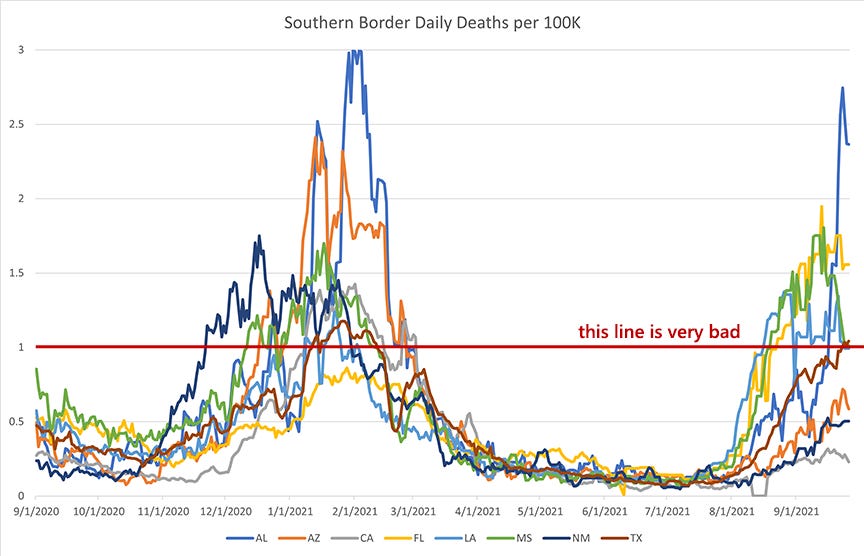
Southern Border (Alabama, Arizona, California, Florida, Louisiana, Mississippi, New Mexico, Texas)
Mid-South (Arkansas, Georgia, Kentucky, North Carolina, South Carolina, Tennessee, Virginia, West Virginia)
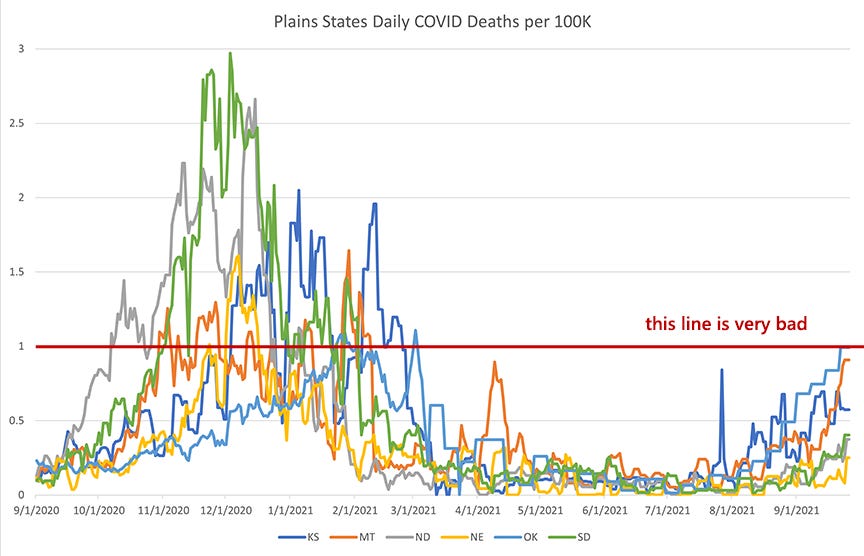
Plains States (Kansas, Montana, North Dakota, Nebraska, Oklahoma, South Dakota)
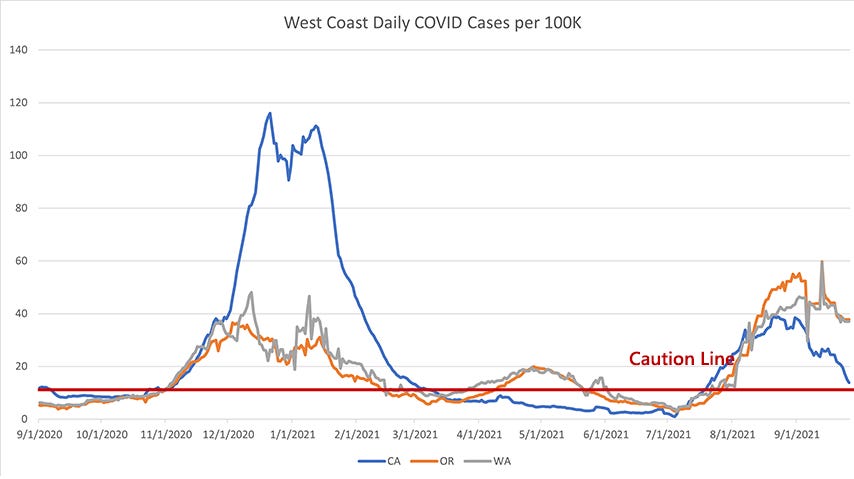
West Coast (Washington, Oregon, California)
Upper Northeast + Alaska & Hawaii (Vermont, New Hampshire, Maine, Alaska, Hawaii)
Summary
Midwest
It looks very much like the current surge in the midwest is peaking. We will likely see the death rate creep up in most of these states next month as it follows the case surge pattern, but I’d be surprised if it gets as high as Michigan’s March-April surge. The four states most likely to see this increase in deaths are the cluster of Ohio, Wisconsin, Indiana, and Iowa, where cases have surged higher than Missouri did this summer.
Mountain States
I’ve seen a lot of press about Idaho, which is undergoing a pretty substantial surge right now, but I honestly think that the more curious story is Nevada, which has sustained a pretty high death rate over the last two months despite their case rate not being particularly high. I’m not entirely certain why the focus has been on Idaho, which is substantially smaller than Nevada.
Utah continues to be something of an outlier in that their case rates spike while their death rates stay fairly low. I’ve previously speculated that this is because Utah is a particularly young state (lowest median age in the country), but I would love to see someone explore this phenomena in more detail.
Northeast
The surge in the northeast also seems to be peaking, though it never really got high enough that I think it counts as a real “surge”. With daily cases plateauing at 40 per 100K residents, this could be an artifact of increased testing due to schools starting up again. There has been a shallow increase in deaths, but nothing that indicates anything more than the seemingly endless plod of endemic COVID.
I’ve seen people suggest that the northeast will see a winter surge, and, while that is certainly possible, I don’t see the signs of it taking off at this moment. It could be (as I’ve seen others suggest) that the northeast has high enough vaccination rates that they won’t see a winter surge, but I’m fairly unconvinced by that given that we’ve seen surges in other states with higher vaccination rates.
Southern Border
The southern border states are clearly on the other side of the massive summer surge that hit the gulf states particularly hard. Deaths are still coming in from that surge, but it looks like we hit the peak for that as well. I haven’t seen any news on this but Alabama’s recent death spike looks like it might be the result of a backlog of deaths, I would be very surprised if it stayed up at 2.5 daily deaths per 100K for more than a week.
There is reason to hope that this surge means that the gulf states won’t have a bad winter surge but it’s hard to make predictions, especially about the future.
Mid-South
You can see this when you play the animated map I linked at the top, but it looks like the current COVID surge just travelled north from the gulf states to into the mid-south states. Tennessee has been hit pretty hard and I suspect they are not at the peak of death reporting for this surge.
That being said, it seems likely that we are on the other side of this surge as far as cases are concerned. I would expect the numbers to drop over the next 4-6 weeks, followed by drops in hospitalizations and deaths. Like the gulf states, I hope this means that they won’t see a winter surge.
Plains States
The plains states can be hard to read because low-population states can be prone to delivering spiky data, but the current surge seems to have reached a peak in most of these states (though it’s hard to tell with Montana). I think we’ll still see increases in reported deaths over the next 2-3 weeks before they also subside, but this has been (so far) substantially lower than what we saw last year.
West Coast
The west coast has been largely spared throughout this pandemic. Washington and Oregon have among the lowest overall COVID death rates in the nation (about the same as Utah). They are currently in the biggest surge that they’ve seen, but even that surge is shallow compared to most other states.
What I find very strange is that this post-vaccine surge is going higher in both daily cases and daily deaths than their pre-vaccine surge. That seems odd and deeply concerning. They do seem to be on the downslope of this surge, which is encouraging.
Upper Northeast + Alaska & Hawaii
The current COVID spike in Alaska is quite alarming. Their spike in deaths is much higher than anything they’ve seen in this pandemic so far. It is a fairly recent development, so it’s hard to say if it will climb further, but given how recent their case rate spike has been, I would think that it will rise further.
This grouping of states has always been a bit of a hodge-podge, mostly just farthest flung areas of the US collected into one group. But it’s interesting that these 5 states all have some of the lowest overall COVID death rates. These low rates are paired with some of the highest rates of COVID vaccination (Vermont is the highest, Hawaii the third highest for “at least 1 dose”). Given that, I think the fact that we’re still seeing surges in these states is reason for pause.
Summary
This month in COVID data is a mixed bag. Yes, it’s good that the overall cases and deaths are trending downward, but it’s incredibly concerning to see so many states (red and blue both, not that this should matter) where their current post-vaccine COVID surges are matching or exceeding their pre-vaccine COVID surges. That seems very counter intuitive and I’m not sure what to make of it. The best strategy is probably just to keep an eye on things and hope the next few months don’t see additional surges.
Looney Tunes: Now Hear This (1963)
This is a strange cartoon. It’s a Chuck Jones piece, but it constructed entirely of stock sound effects, many of which a careful listener may recognize from other Looney Tunes cartoons (I spotted several that were also used in the Daffy Duck classic Duck Amuck).
The entire cartoon is incredibly abstract and feels as if it was designed around these sound effect. There are elements of this cartoon that almost feel like they came out of a Rocky and Bullwinkle episode, so rudimentary is the animation at times. Not crazy enough to be fascinating and not funny enough to warrant many repeat viewings, I was a bit disappointed in this short.


Thanks for your great articles. You ask why the focus on Idaho and not Nevada. It's probably because Idaho has, gasp, a Republican governor and Nevada has, surprise, a Democrat as governor. Focusing on Nevada would not fit the narrative that COVID exists where Republicans are in control.
re: your conclusion: "but it’s incredibly concerning to see so many states (red and blue both, not that this should matter) where their current post-vaccine COVID surges are matching or exceeding their pre-vaccine COVID surges." -- yes, troubling, especially when vaccination rates are so high especially among the older population. With more than 65% of adults fully vaccinated (and higher in areas like NYC and SF and the older population in FL, etc), and many with natural immunity, you should see far smaller seasonal peaks. One data analyst (El Gato) has suggested that the window immediately after the first vaccination makes the individual MORE vulnerable. Other people have suggested that the vaccines are less effective than we've been led to believe. I'm particularly concerned that doctors are being silenced and vaccine related illnesses and side effects are being suppressed/not reported. I don't have an answer -- but I don't think the CDC is being transparent at all and that really concerns me, especially with the push for boosters and vaccinating children and not recognizing natural immunity.